Population & Population growth
Austin’s population is No. 1 for rates of population growth and net migration since 2020 among the top 50 metros. Austin ranks 2nd among large metros for percent of the population that moved in within the last year. In the past year, 6.6% of the population (145,620 people) moved into Austin from outside the metro.
2010 | 2020 | 2023 | 2010-2020 % Ch. | 2020-2023 % Ch. | |
|---|---|---|---|---|---|
Austin MSA | 1,716,307 | 2,283,379 | 2,473,275 | 33.0% | 8.3% |
Bastrop Co. | 74,230 | 97,218 | 110,778 | 31.0% | 13.9% |
Caldwell Co. | 38,014 | 45,880 | 49,859 | 20.7% | 8.7% |
Hays Co. | 156,978 | 241,057 | 282,486 | 53.6% | 16.4% |
Travis Co. | 1,024,314 | 1,290,218 | 1,334,961 | 26.0% | 3.5% |
Williamson Co. | 422,771 | 609,006 | 697,191 | 44.1% | 14.5% |
Texas | -- | -- | -- | 15.9% | 4.7% |
United States | -- | -- | -- | 7.4% | 1.0% |
Population Projections
2020 | 2030 | 2040 | 2050 | 2060 | |
|---|---|---|---|---|---|
Austin MSA | 2,283,371 | 2,918,491 | 3,611,330 | 4,371,103 | 5,237,825 |
Bastrop Co. | 97,216 | 120,901 | 150,018 | 184,520 | 223,711 |
Caldwell Co. | 45,883 | 53,749 | 61,689 | 69,133 | 76,291 |
Hays Co. | 241,067 | 356,181 | 513,812 | 721,388 | 1,003,130 |
Travis Co. | 1,290,188 | 1,572,639 | 1,820,417 | 2,035,923 | 2,252,137 |
Williamson Co. | 609,017 | 815,021 | 1,065,394 | 1,360,139 | 1,682,556 |
Growth Rates
2020-2030 | 2030-2040 | 2040-2050 | 2050-2060 | |
|---|---|---|---|---|
Austin MSA | 27.8% | 23.7% | 21.0% | 19.8% |
Texas | 12.9% | 11.8% | 10.4% | 9.2% |
Population Growth
2013-2023
Educational Attainment
Austin ranks 4th among the top 50 metros for population with at least a bachelor’s degree.
Persons 25 years or older, 2022
Race & Hispanic Origin
Austin’s population is diverse and continues to attract talent from around the world. Among metro area residents over the age of one year in 2022, 7.5% moved into the area within the preceding year. The Hispanic or Latino population makes up nearly 33% of the metro’s population and grew 35% between 2010 and 2020. The Asian population and the Black or African American population each account for approximately 8% of the area’s population in 2022. Asian population growth was 96% over the last decade while Black or African American growth was 26%.
Population by race & Hispanic origin, Austin MSA, 2022

TOTAL | NON-HISPANIC | HISPANIC | |
|---|---|---|---|
Total population | 2,421,115 | 1,630,213 | 790,902 |
White | 1,930,381 | 1,207,372 | 722,902 |
Black or African American | 201,308 | 179,801 | 21,507 |
American Indian & Alaska Native | 28,412 | 6,707 | 21,705 |
Asian | 1,875,520 | 181,719 | 5,833 |
Native Hawaiian & other Pacific Islander | 3,558 | 2,031 | 1,527 |
Two or more races | 70,004 | 52,583 | 17,421 |
Density
Income
Households by income group, 2022
Age & Sex
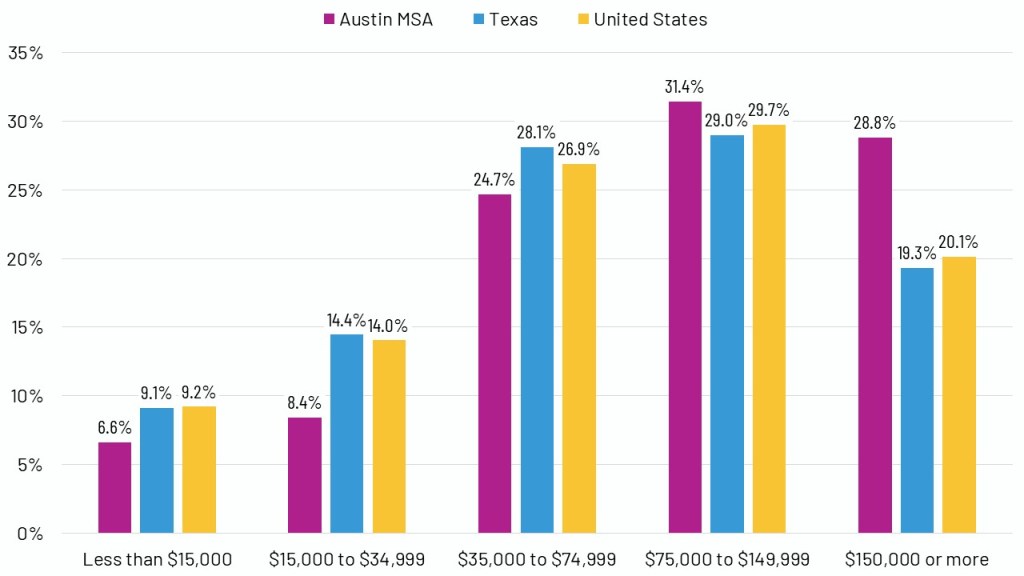
Over 43% of the region’s population is in the peak working years between the ages of 18-44 (compared to 36% nationally). The median age of the Austin metro is three years younger than the national median (35.9 years vs. 38.9 years).
Austin’s median age is the 6th lowest among the 50 largest metros.
Population distribution by age, 2022
TOTAL | MALE | FEMALE | |
|---|---|---|---|
Total population | 2,421,115 | 1,227,540 | 1,193,575 |
0-17 | 522,113 | 267,623 | 254,492 |
18-24 | 234,287 | 117,767 | 116,520 |
25-44 | 812,218 | 423,193 | 389,025 |
45-64 | 563,843 | 288,492 | 275,351 |
65+ | 288,654 | 130,465 | 158,189 |
Median age | 35.9 yrs | 35.6 yrs | 36.4 yrs |

