If the large employers reflect diversity, it is the smaller ones that reflect the economy's dynamism.
Ever since Michael Dell started selling computers from his University of Texas dorm room, thousands of talented, creative people have started businesses in Austin. That momentum has grown exponentially over the ensuing years; the Austin region has proven to be fertile ground for enterprises of all sizes looking to expand.
| BUSINESS ESTABLISHMENTS BY EMPLOYMENT-SIZE CLASS, 2020 | |||||
|---|---|---|---|---|---|
|
|
TOTAL |
EMPLOYMENT-SIZE CLASS |
|||
|
|
|
1-19 |
20-99 |
100-499 |
500+ |
|
Austin MSA
|
57,973 |
49,052 |
7,446 |
1,314 |
200 |
|
Bastrop Co. |
1,494 |
1,340 |
133 |
17 |
|
|
Caldwell Co. |
658 |
577 |
66 |
15 |
|
|
Hays Co. |
4,807 |
4,099 |
618 |
80 |
8 |
|
Travis Co. |
38,547 |
32,415 |
5,073 |
944 |
154 |
|
Williamson Co. |
12,467 |
10,621 |
1,556 |
258 |
38 |
| BUSINESS ESTABLISHMENTS BY EMPLOYMENT-SIZE CLASS, AUSTIN MSA | |||||
|---|---|---|---|---|---|
|
|
TOTAL |
EMPLOYMENT-SIZE CLASS |
|||
|
|
|
1-19 |
20-99 |
100-499 |
500+ |
|
2015 |
48,893 |
41,321 |
6,357 |
1,093 |
122 |
|
2016 |
50,759 |
42,850 |
6,592 |
1,190 |
127 |
|
2017 |
52,858 |
44,620 |
6,903 |
1,204 |
131 |
|
2018 |
54,446 |
45,970 |
7,093 |
1,235 |
148 |
|
2019 |
56,137 |
47,483 |
7,232 |
1,274 |
148 |
|
2020 |
57,973 |
49,052 |
7,446 |
1,314 |
200 |
Source: U.S. Bureau of the Census, County Business Patterns.
Announced Relocations & Expansions
| RECENT ANNOUNCEMENTS TO EITHER LOCATE SIGNIFICANT NEW FACILITIES OR EXPAND EXISTING OPERATIONS HAVE BEEN MADE BY: | |||||
|---|---|---|---|---|---|
|
Amazon Ametrine Arrive Logistics BAE Systems The Boring Company Cangshan Cutlery CelLink Charles Schwab CloudFlare Curative DJO Surgical F45 Training Fincons Group Firefly Aerospace |
Flex GetSales Hippo Financial Hyliion Magnitude Markaaz Oracle Ovivo Peak6 Pimco Plastikon Q2 R3E Realtor.com Rev |
Saleen Performance Parts Samsung Shop LC Simwon America Corp. Stamps.com Tata Consultancy Services Tesla Thermo Fisher Scientific TikTok U.S. Army Futures Command US Farathane Wayfair Whole Foods Wise The Zebra |
|||
| CONSTRUCTION COST INDEX, 2019 | |||||
|---|---|---|---|---|---|
|
|
RESIDENTIAL |
COMMERCIAL |
|||
|
Atlanta |
88 |
89 |
|||
|
Austin |
79 |
83 |
|||
|
Boston |
118 |
114 |
|||
|
Chicago |
125 |
121 |
|||
|
Dallas |
83 |
86 |
|||
|
Denver |
89 |
90 |
|||
|
New York |
139 |
132 |
|||
|
Phoenix |
87 |
88 |
|||
|
Raleigh |
93 |
84 |
|||
|
Salt Lake City |
85 |
90 |
|||
|
San Francisco |
132 |
129 |
|||
|
Seattle |
105 |
107 |
|||
|
United States |
100 |
100 |
|||
Source: R.S. Means.
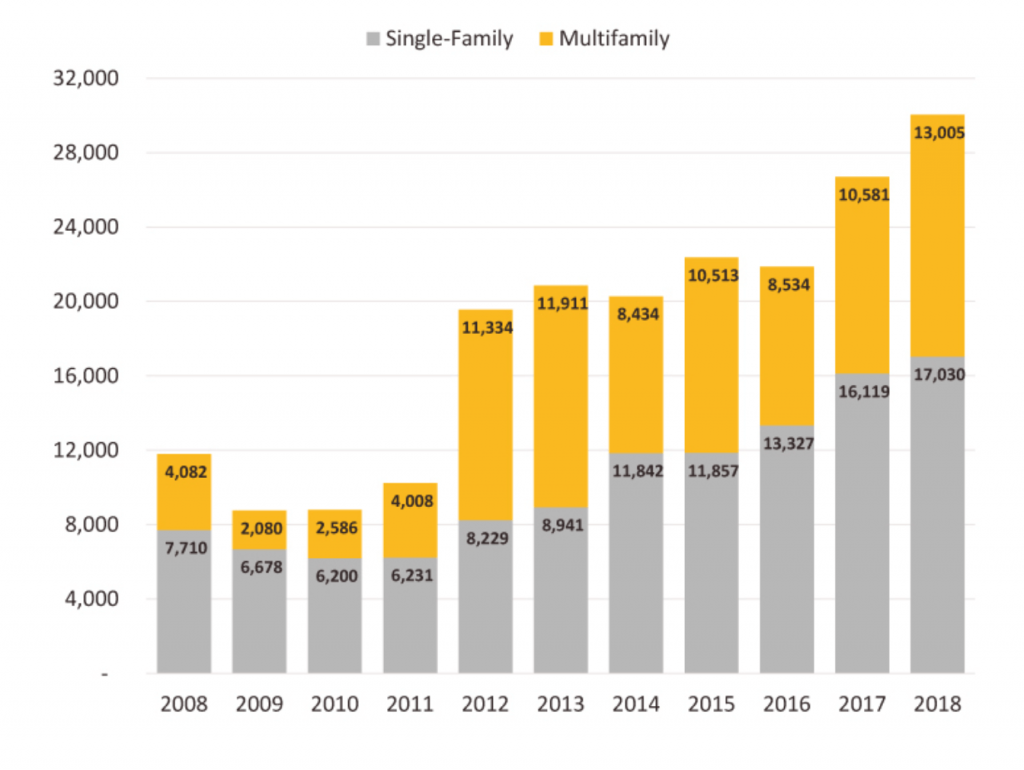
| RESIDENTIAL PERMITS BY COUNTY, 2018 | ||||||
|---|---|---|---|---|---|---|
|
|
TOTAL |
SINGLE-FAMILY UNITS |
MULTI-FAMILY UNITS |
|||
|
Austin MSA |
30,035 |
17,030 |
13,005 |
|||
|
Bastrop County |
156 |
150 |
6 |
|||
|
Caldwell County |
478 |
270 |
208 |
|||
|
Hays County |
2,890 |
2,890 |
– |
|||
|
Travis County |
19,520 |
8,978 |
10,542 |
|||
|
Williamson County |
6,991 |
4,742 |
2,249 |
|||
Source: U.S. Bureau of the Census.
Note: Additional residential permits data is available via the Chamber’s Economic Indicators page.
| RETAIL SECTOR, AUSTIN MSA | ||
|---|---|---|
|
|
ESTABLISHMENTS |
SALES (MILLIONS) |
|
2010 |
16,499 |
$23,565 |
|
2015 |
19,969 |
$33,547 |
|
2020 |
24,174 |
$37,722 |
| RETAIL SECTOR BY COUNTY, 2020 | ||
|---|---|---|
|
|
ESTABLISHMENTS |
SALES (MILLIONS) |
|
Bastrop County |
1,006 |
$1,414.2 |
|
Caldwell County |
431 |
$391.8 |
|
Hays County |
2,540 |
$5,134.5 |
|
Travis County |
13,864 |
$20,891.1 |
|
Williamson County |
6,334 |
$9,890.9 |
Note: Additional retail sales data is available via the Economic Indicators page.
Residential Building Permits