
The Austin economy
The US Census Bureau’s 2025 American Community Survey, released in late October, offers a fresh look at socioeconomic data across the nation’s metro areas. The Austin region continues to rank near the top in several categories, reflecting the region’s growth and highly skilled workforce.
- Migration: More than 160,000 people moved to the metro from outside the region last year. At 6.27% of the population, the Austin region has the highest share of new residents among the top 50 metros.
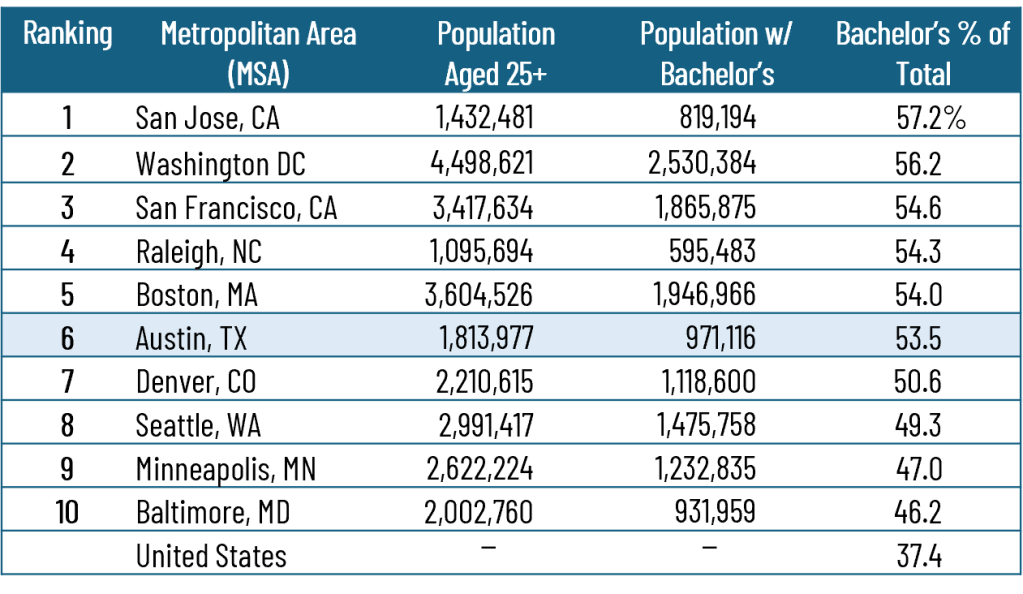
- Education: Austin holds its No. 6 ranking for bachelor’s degree attainment, with the share of residents 25 and older holding at least a bachelor’s degree rising from 52.3% in 2024 to 53.5% in 2025.
- Labor force: Austin moved up from third to second in labor force participation among residents 16 and older. Its 71.5% rate trails only Salt Lake City (72.4%).
American Community Survey Highlights
Just released in late October, the Census Bureau’s American Community Survey (ACS) 2025 data shows the Austin region continuing to perform well in key indicators that make it an attractive place for growing employers.
The Austin metro area, the 25th largest in the US has the third lowest median age of the Top 50 metros at 35.7 years behind Salt Lake at 34.2 and Fresno at 34.5. The US and Texas median age were 39.5 and 36.2, respectively. In addition to being a young, vibrant population, the Austin region features a very high level of educational attainment with a Bachelor’s degree or higher held by 53.5% of our population over 25 years, up from 52.3% in 2024. Only five other metros had a higher rate as shown in the table. Of the other major TX metros, Dallas’ rate was next highest at 41.2%.
In addition to being well-credentialed, the Austin region’s population ranks as having one of the highest labor force participation rates in the nation with 71.5% of our population aged 16+ active in our workforce. Only Salt Lake City has a higher rate at 72.4%.
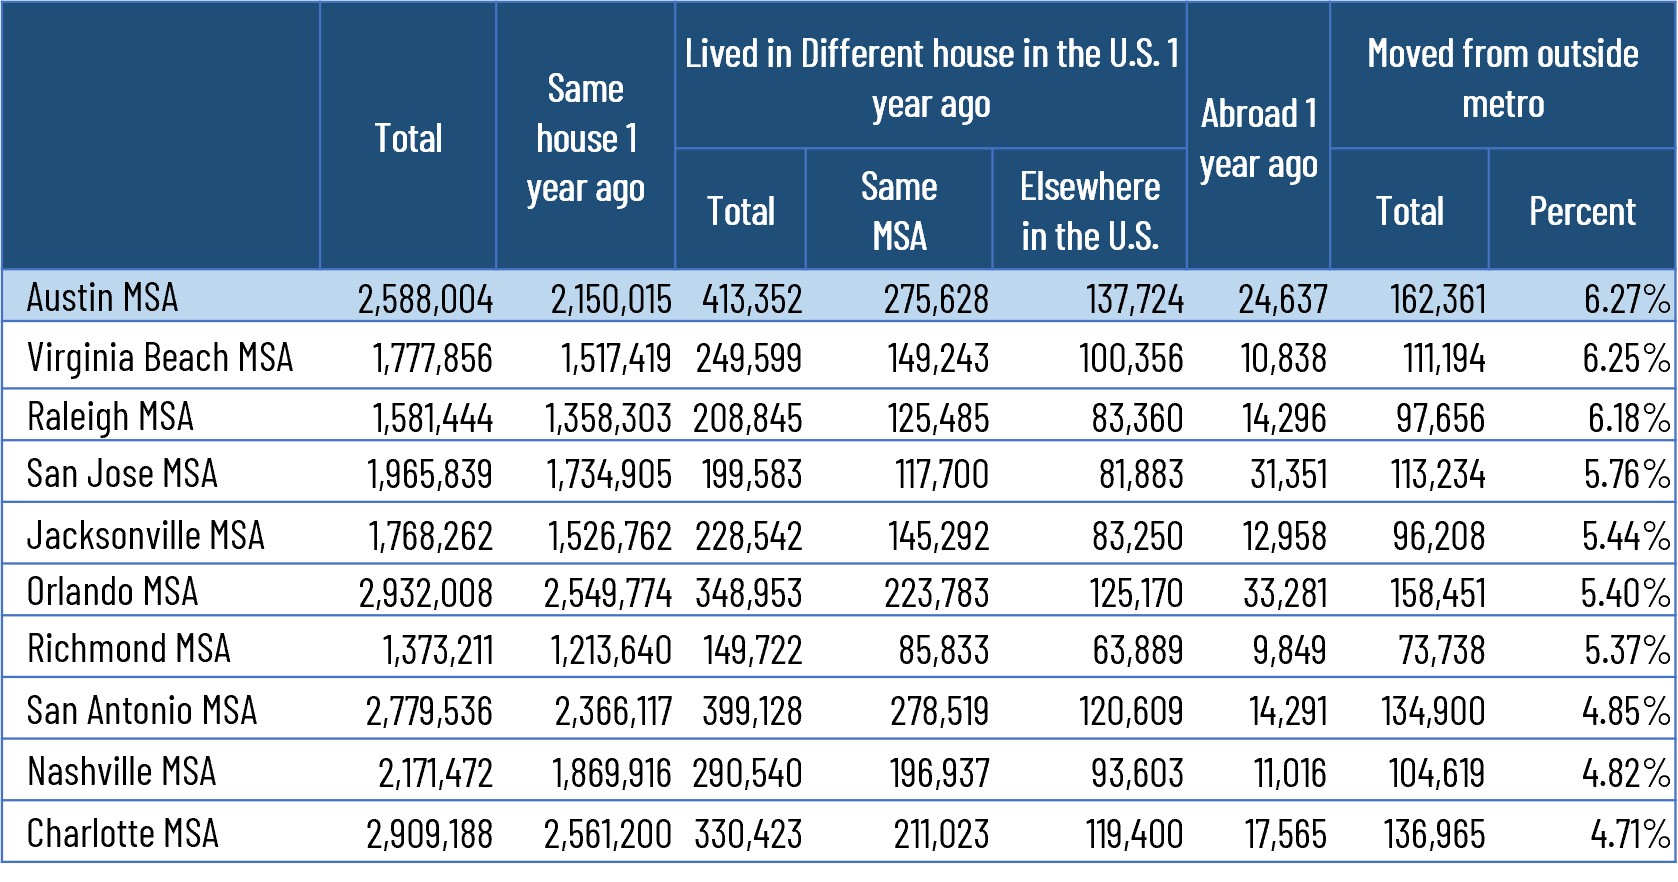
Austin continues to be a magnet for migration as employees look to opportunities created by the region’s growing employers. In fact, the recent ACS 2025 data shows that Austin had a higher concentration of new people to our region than any of the other large metro areas. About 162,000 people moved into our region in the last year from outside the metro or about 6.27% of our total population. Virgina Beach and Raleigh had the next two highest rates at 6.25 and 6.18%, respectively. Nearly 25,000 moved into the metro from outside of the US. These statistics highlight a thriving region.
Source: U.S. Census Bureau, ACS, 2025.
Non-Farm Payroll Job Growth
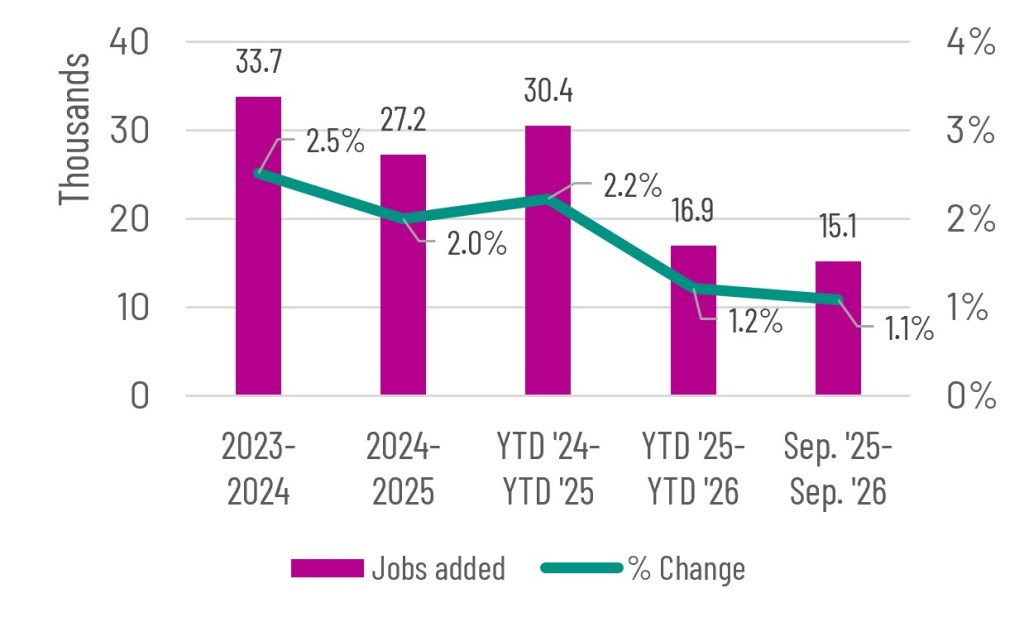
For the year ending in September 2026, Austin has added 15,100 jobs, according to the Current Employment Statistics Program. Seasonally-adjusted jobs were down 0.1% or 1,500 from August to September 2026.
Austin’s job growth of 1.1% from Sept. 2025 to Sept. 2026 matched the overall rate in TX (1.1%) and exceeded the US rate of 0.3%. Austin was ranked in a tie with Minneapolis for the 6th best performing of the Top 50 metros in September 2026 for job growth. The metro with the fastest job growth was Charlotte at 1.9%, while Las Vegas and San Jose were tied for second with growth of 1.7%. Rounding out the top 5 were San Diego, 1.3% and Fort Worth, 1.2%. Source: U.S. Bureau of Labor Statistics (BLS), CES.
Source:U.S. BLS, CES.
Top Job Gains/Losses by Industry, September 2026
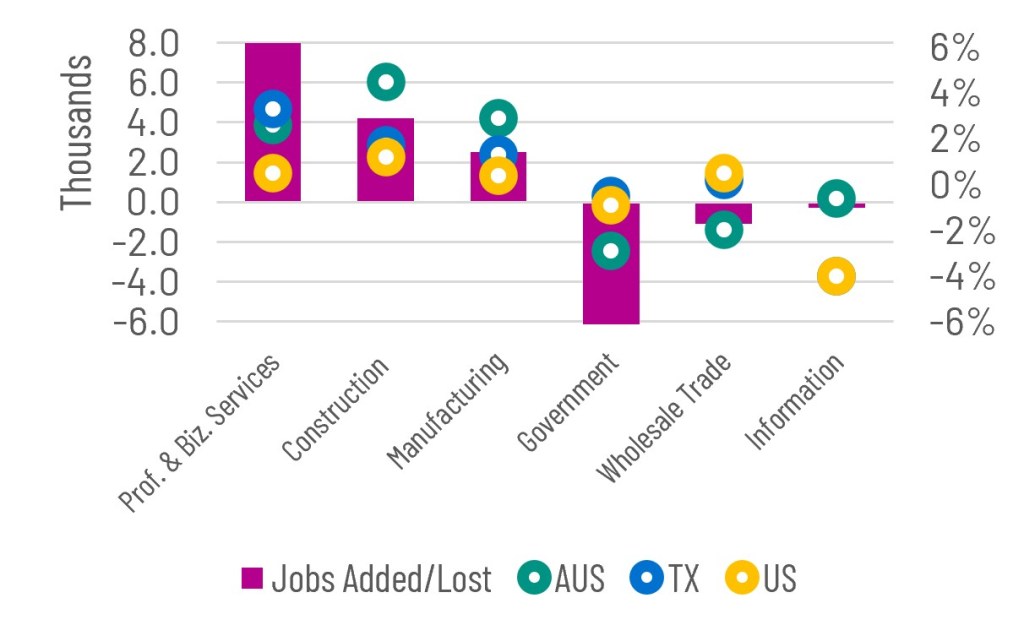
The best performing industries in Austin over the last year were Professional & Business Services (8,000, 2.8%), Construction, Natural Resources, & Mining (4,200 additional jobs, 4.5%), and Retail Trade (2,400, 2.0%). Austin’s job growth rate for Construction and Manufacturing sectors significantly outperformed both TX and the US, while Professional & Business Services jobs exceeded the US, but trailed Texas. Retail Trade, adding 2,400 jobs at a rate of 2.0% also overperformed in Austin.
The worst performing industries within the Austin region were Government (-6,200, -2.9%), Wholesale Trade (-1,100, -2.0%), and Information (-300, -0.6%).
Source:U.S. BLS, CES.
Unemployment
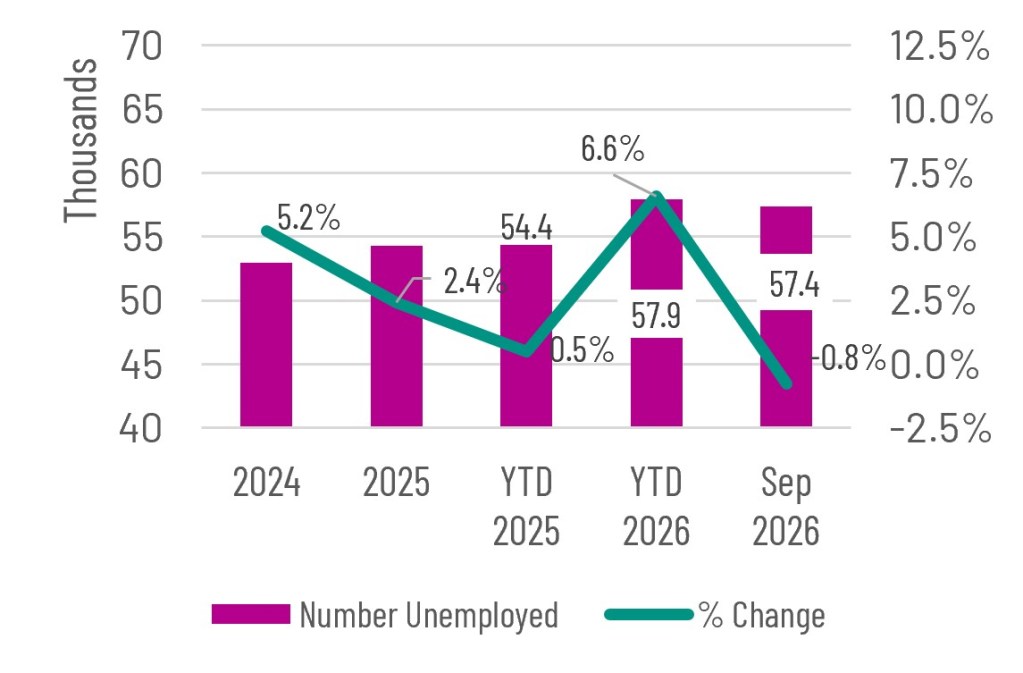
After a steep 5.2% increase in the number of unemployed individuals in 2024, the number increased at a slower rate, 2.4% in 2025. The number of currently unemployed people is 0.8% higher than one year ago, while the number unemployed in Texas is also up by 5.5%. However, across the US the number unemployed is essentially unchanged, up 0.1%.
In Sept. 2026, the number unemployed totaled 57,387 in the Austin region, which is 450 less than one year ago. In TX, the state experienced 24,900 less unemployed over the past year, while the total across the US decreased by 465,000
Source: U.S. BLS, LAUS
Unemployment Rate Comparison
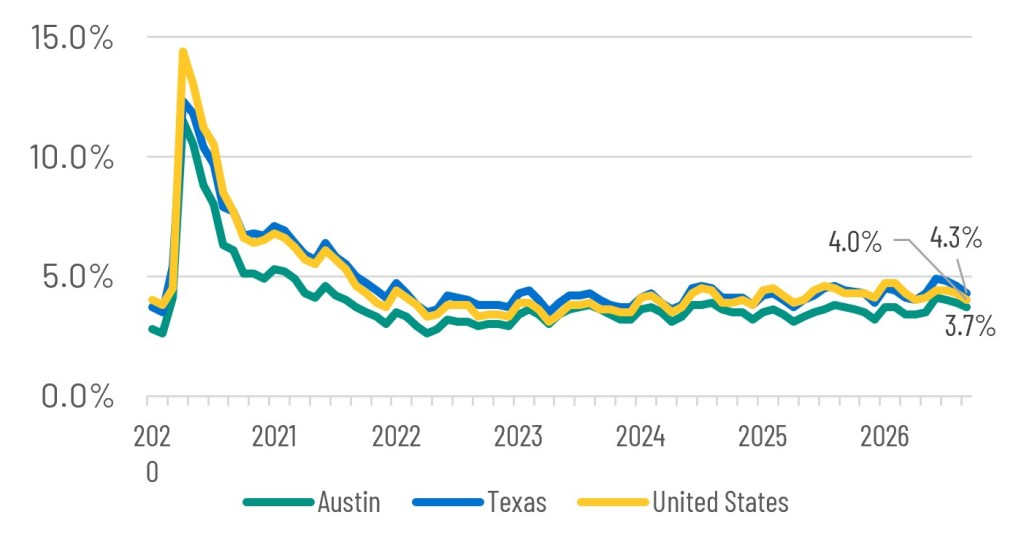
The unemployment rate for the Austin region was 3.7% in September, which is unchanged from one year ago. Austin’s rate continues to perform better than both TX and the U.S. at 4.3% and 4.0%, respectively. Other TX metros including Dallas-Fort Worth, 4.1%, San Antonio, 4.3%, and Houston, 4.6% were all higher than Austin’s rate. In Sept. 2026, Austin had the 17th lowest unemployment rate of the Top 50 US metros.
Since recovering from a peak of 11.5% during COVID, Austin’s rate averaged 3.5% in 2023, 2024, and 2025, Austin YTD rate has averaged 3.7% this year. TX’s rate rose to 12.3% during COVID and declined to 4.0% in 2023 and has since averaged 4.2% in 2025, while YTD the rate is 4.4%. The US rate reached 14.4% in COVID and declined to 3.6% in 2023 but has since risen to 4.3% in 2025, while YTD the rate is averaging 4.3%.
Source: U.S. BLS, LAUS.
Workforce Hours & Earnings
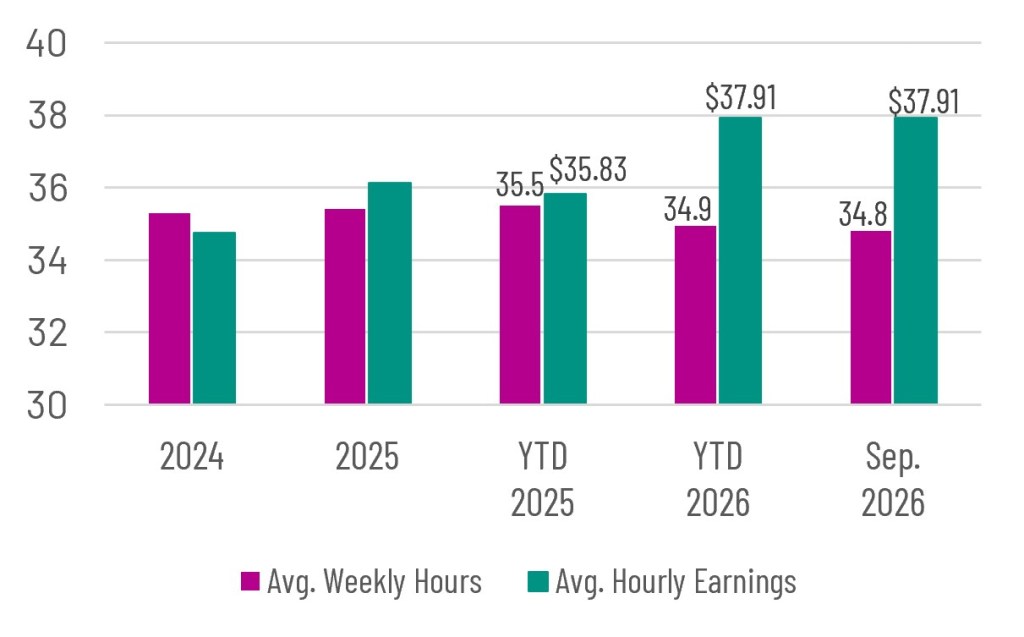
The average number of hours worked for payroll jobs in the Austin region in Sep. 2026 was 34.8, up from 35.2 this time last year. For 2026 YTD, hours worked is down 1.6% from 2025 YTD. Texas employees worked the same as last year at 36.1 hours per week, while the US average was up a three tenths at 34.3.
Average hourly earnings rose in Austin were $36.11 in 2025, up 3.9% compared to increases of 4.6% in Texas and 4.0% in US. For the first nine months of 2026, average earnings in Austin were up 5.5% from $35.83 to $37.91. Increases both in the TX and the US were less profound at 3.6% and 3.2%.
Source:U.S. BLS, CES.
Metro Business Cycle Index
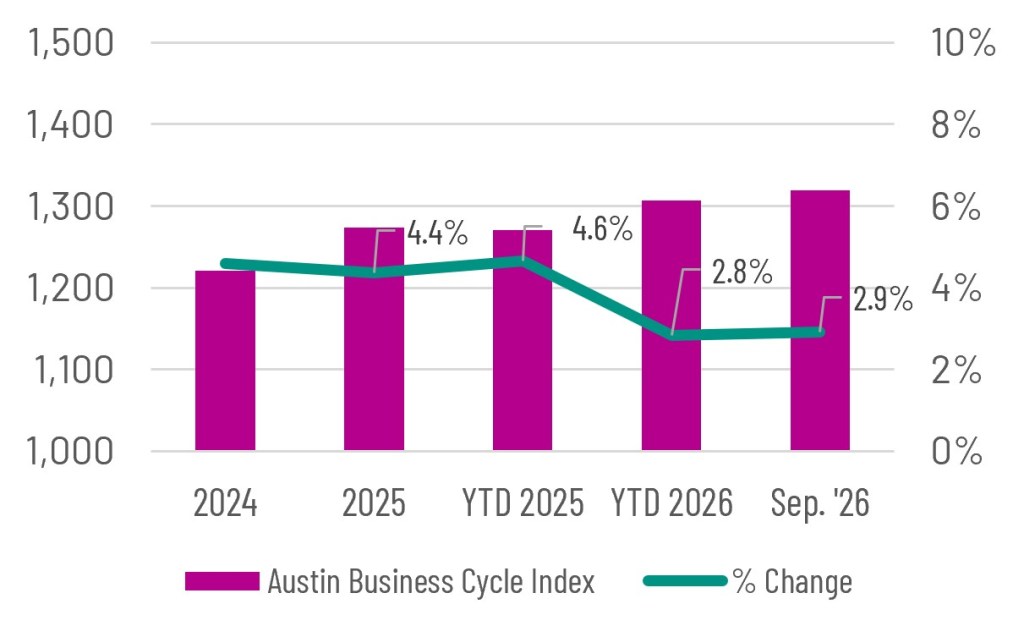
The Austin metro’s business cycle index continues to show growth in both the YTD and YoY comparison through September. After growth of 4.4% in 2025, the rate slowed to 2.8% for YTD 2026 compared to YTD 2025 growth of 4.6%.
Statewide, the business cycle index growth grew by 2.5% from YTD 2025 to YTD 2026, compared to growth of 2.7% from YTD 2024 to YTD 2025. Across Texas, YTD growth in the other major metros were -0.1% in San Antonio and 0.6% in Houston, while Ft. Worth and Dallas were 2.6% and 2.2%, respectively. Produced by the Federal Reserve of Dallas, the business cycle index reflects broad economic conditions including unemployment, inflation-adjusted wage and retail sales growth
Source:Dallas Federal Reserve.
Sales Tax Receipts
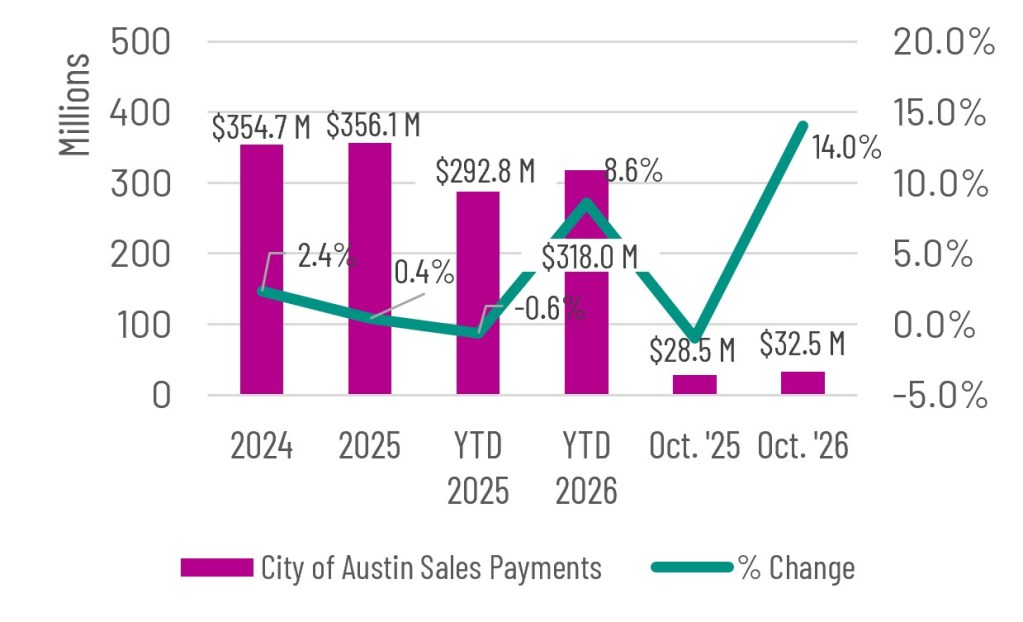
Sales tax allocation payments to the City of Austin totaled $356 million in 2025, a slight increase of 0.4% over 2024. Previously, payments were up 2.4% in 2024. For Oct. 2026, the City of Austin received $32.5 million, up 14.0% from Oct. 2025. YTD 2026 receipts are up 8.6% compared to -0.6% in YTD 2025.
In Round Rock, receipts totaled $129M and were up 10.5% in 2025 following a drop of -1.4% in 2024 and growth of 1.4% in 2023. San Marcos received 0.5% more in sales tax receipts in 2025 to $39M, which follows a decline of -2.1% in 2024 and growth of 4.2% in 2023. For YTD 2026 receipts were up 75.2% in Round Rock and up 3.4% in San Marcos over YTD 2025.
Source: Texas Comptroller.
AUS Airport Passenger Activity
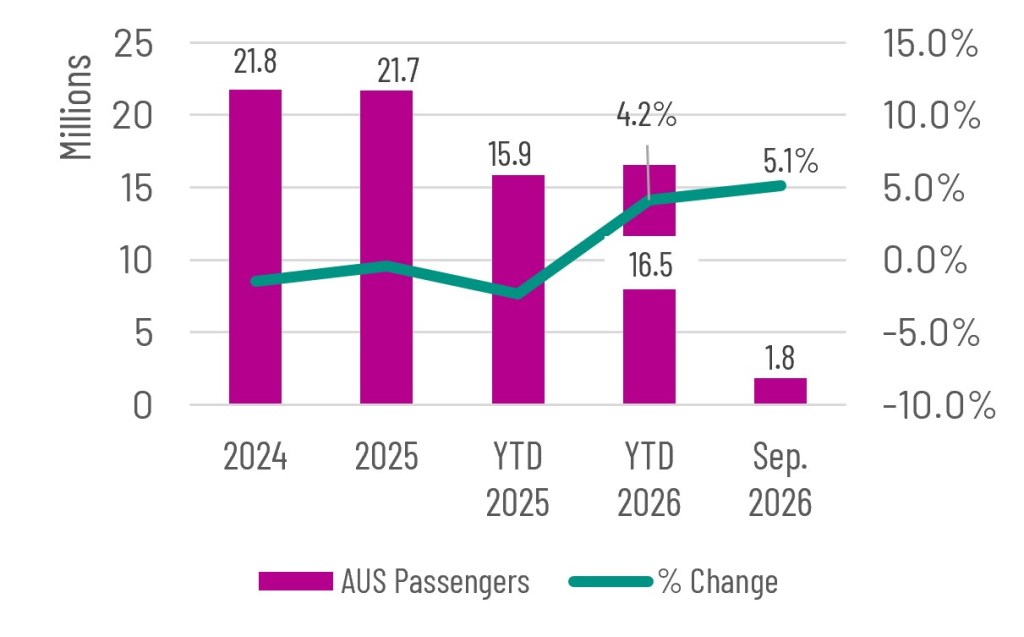
Annual passenger counts through the Austin airport hit 21.6 million passengers in 2025, a drop of 0.4% from 2024. Through September 2026, YTD totals are 16.5 million, up from the same time last year at 15.9 million. Sept. 2026 had a total passenger volume of 1.82 million, making it the busiest Sept. in airport history ahead of Sept. 2023 with 1.78 million passengers.
Total cargo (including Belly freight, cargo and mail) totaled 276.4 million pounds in 2025, down 8.5% from 301.9 million pounds in 2024. The annual record for total cargo occurred in 2022 with 310.1 million pounds transported. Sept. 2026 YTD cargo totaled 201.9 million pounds, which was a 1.7% decrease from the same period last year.
Source: City of Austin.
Patent Activity
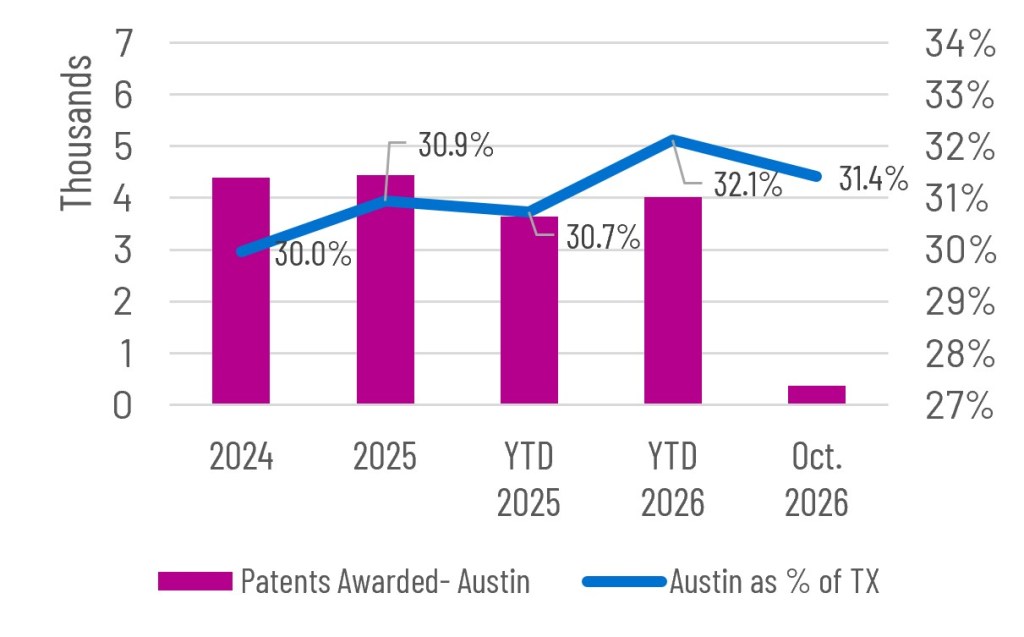
Austin inventors are averaging 4,520 patents applied each year during the 2020’s, which is higher than the 3,762 averaged during the 2010’s. Patent activity totaled 4,442 in 2025, up 1.1% from 2024. Texas saw a 2.2% drop in patents in 2025, while the US was up 0.3%. In Austin, 2026 YTD patents filed totaled 4,010 through October, up by 10.0% from YTD 2025.
Austin represents approximately 32.1% of patent activity in TX this year. This is a truly remarkable data point since the Austin MSA only represents around 8% of the entire population of the State. Austin’s share of TX patents increased to 30.9% in 2025, up from 30.0% in 2024 and 29.5% in 2023.
Source:U.S. Patent & Trademark Office.
Consumer Price Index
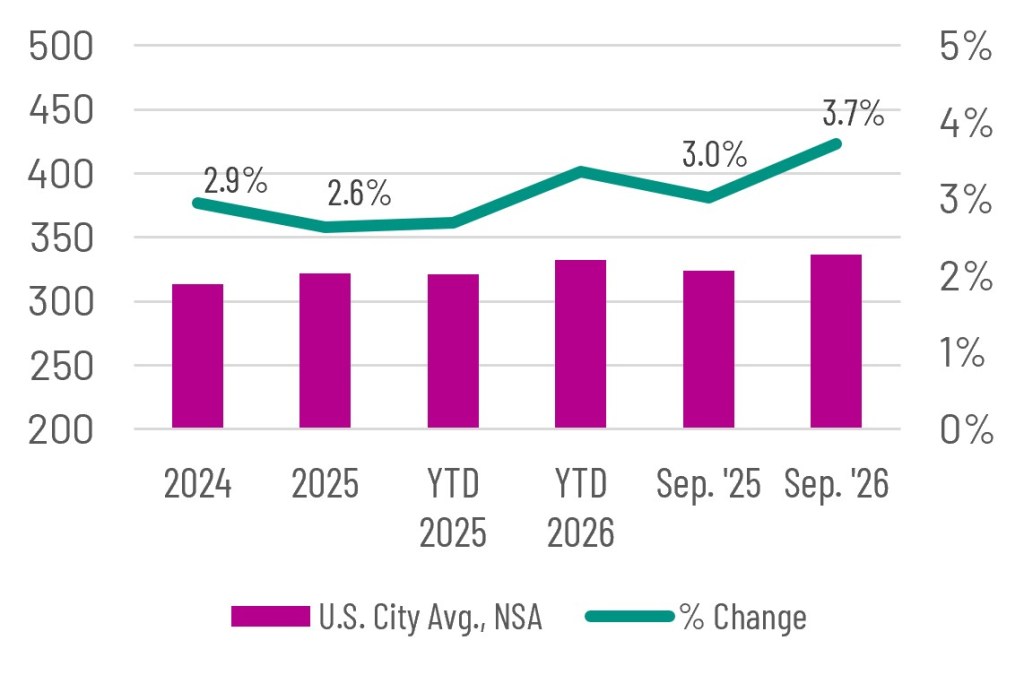
After reaching a 40-year high of 8.0% in the annual percent change in 2022, the U.S. Consumer Price Index growth fell to 2.9% in 2024 and 2.6% in 2025. For the first 3 quarters of 2026, the CPI increased 3.4%. The biggest contributors to the increase were Energy, up 20.4% from last year with Fuel oil up 74.2% and Gasoline up 34.2%. Shelter was up 3.2%, while Medical services were up 2.5% from last year.
While a CPI is not produced for the Austin metro, the Houston and Dallas metro indices were both up by 1.3% in 2025, which is improved from inflation rates of 2.5% and 3.9% in 2024, respectively. YTD rates are 1.6% & 2.2%.
Source:U.S. BLS, CPI.
Housing Permit Activity
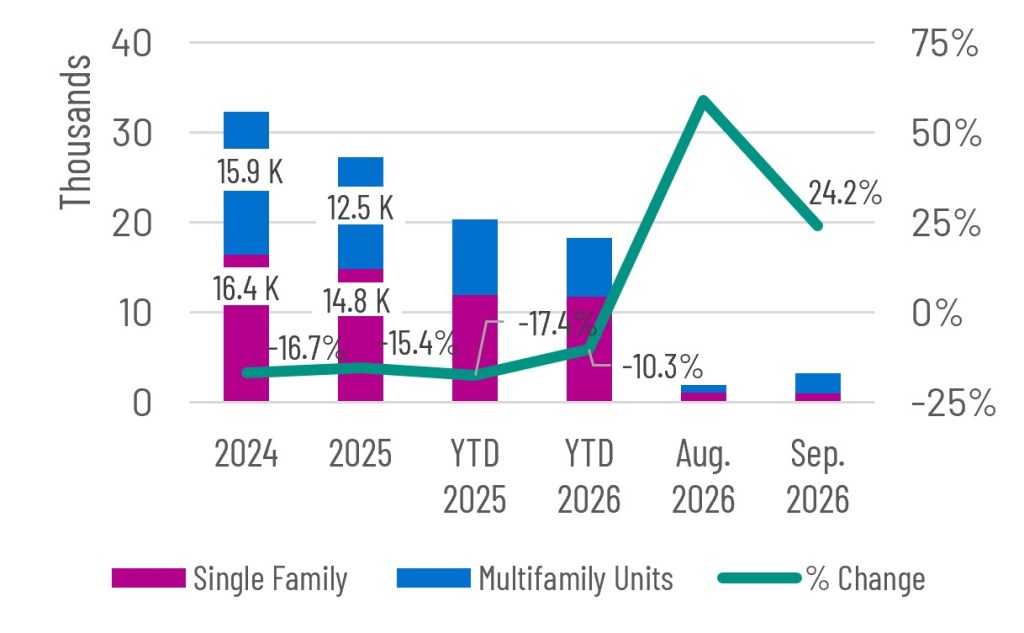
Building permits issued in the Austin region came down from historic highs of between 42,000 to 51,000 units in 2022 and 2021. Last year a total of 27,300 units were issued, down 15.4% from 2024. In Austin, 2026 YTD permits through September were 18,284, down from 20,374 last year, a 10.3% decrease. Nationally, total permits were down -0.5% this year.
For last year in the Austin region, the share of single-family units exceeded multifamily, a continuation from 2024. Previously from 2021 to 2023, multifamily permits exceeded single family. In Sept. 2026, 1,045 single family permits were issued compared to only 2,212 multifamily units. This was a sizable increase in multifamily units compared to last year.
Source: U.S. Census Bureau Building Permits Survey.
Home Sales
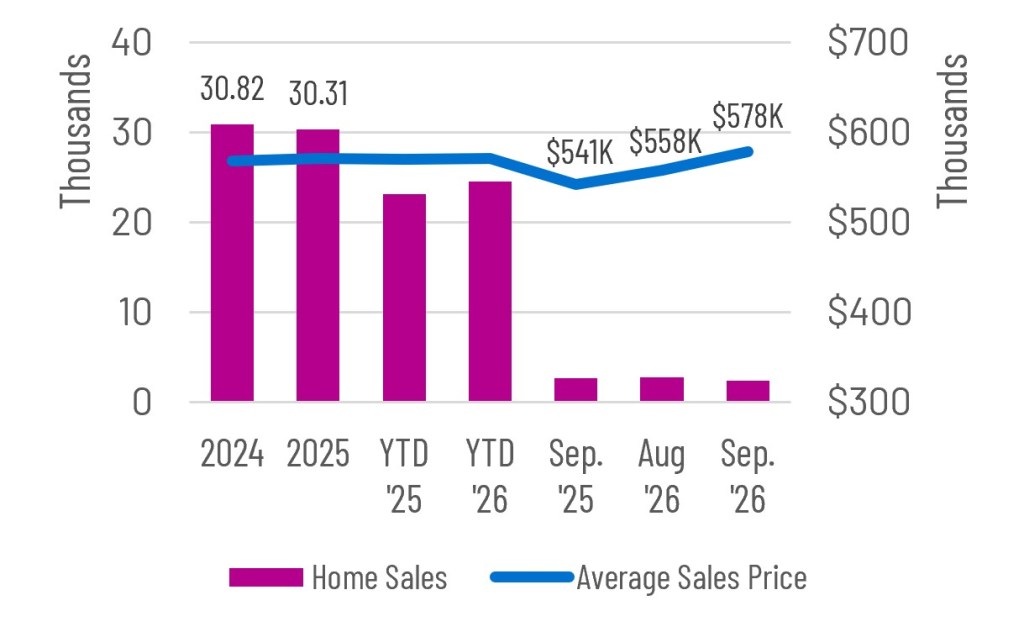
Home sales in the Austin region peaked at 41,094 in 2021. In the past 3 years, total sales have been lower, averaging 30,500. However, for YTD 2026, sales are up by about 1,366 or 5.9% compared to the same time last year. Statewide, YTD sales are up 1.4% compared to 2025, while U.S. sales are up 0.6%.
The average sales price in the Austin region was $570,443 in 2025, a slight increase of about $3,000 from 2024. In Sept. 2026, the average sales price was $577,900 which was up from $541,489 one year ago. In August 2026, months on inventory in Austin was 5.4 months, 0.1 months more than one year ago
Source: TX A&M Real Estate Research Center.
Upcoming Releases
Several key data releases are still to come before the end of the year, each offering a clearer picture of the region’s economic performance. Preliminary job growth for 2026 won’t be available until January 22nd. Opportunity Austin will continue to monitor these releases closely and share updates as new figures become available.
- Nov. 20: Texas Workforce Commission – October Jobs and Unemployment
- Dec. 2: Bureau of Economic Analysis – 2025 GDP and Personal Income by County
- Dec. 2: Bureau of Labor Statistics – Quarterly Census of Employment and Wages, 2026 Q2
More Info & downloads
- Labor force, employment & unemployment
- Employees on nonfarm payrolls
- Hours & earnings
- Consumer price index
- Metro business cycle index
- Sales tax & retail sales
- Housing permits
- Home sales, listings & prices
- Air service
- Patent activity
- Commercial real estate
For questions about this data, please contact Chris Ramser, Vice President, Research or Joseph Morones, Director, Research.