
Gross Domestic Product by Metro & County, January 6, 2025
Beverly Kerr, Vice President, Research
Insights
- Austin has the best performing economy among the top 50 metros over the last 5 years, with GDP increasing 39.0% in real terms, and ranks eighths for its 4.5% growth over the last year.
- GDP growth for the metropolitan portion of the U.S. in aggregate was 2.7% in 2023 with each of the 50 largest metros showing positive growth.
- The financial activities and the professional and business services sectors were the most significant drivers of Austin’s GDP growth in 2023.
- Austin’s real per capita GDP is the 3rd fastest growing among major metros over the last 5 years, increasing 21.9%, compared to 10.1% for the metropolitan portion of the U.S.
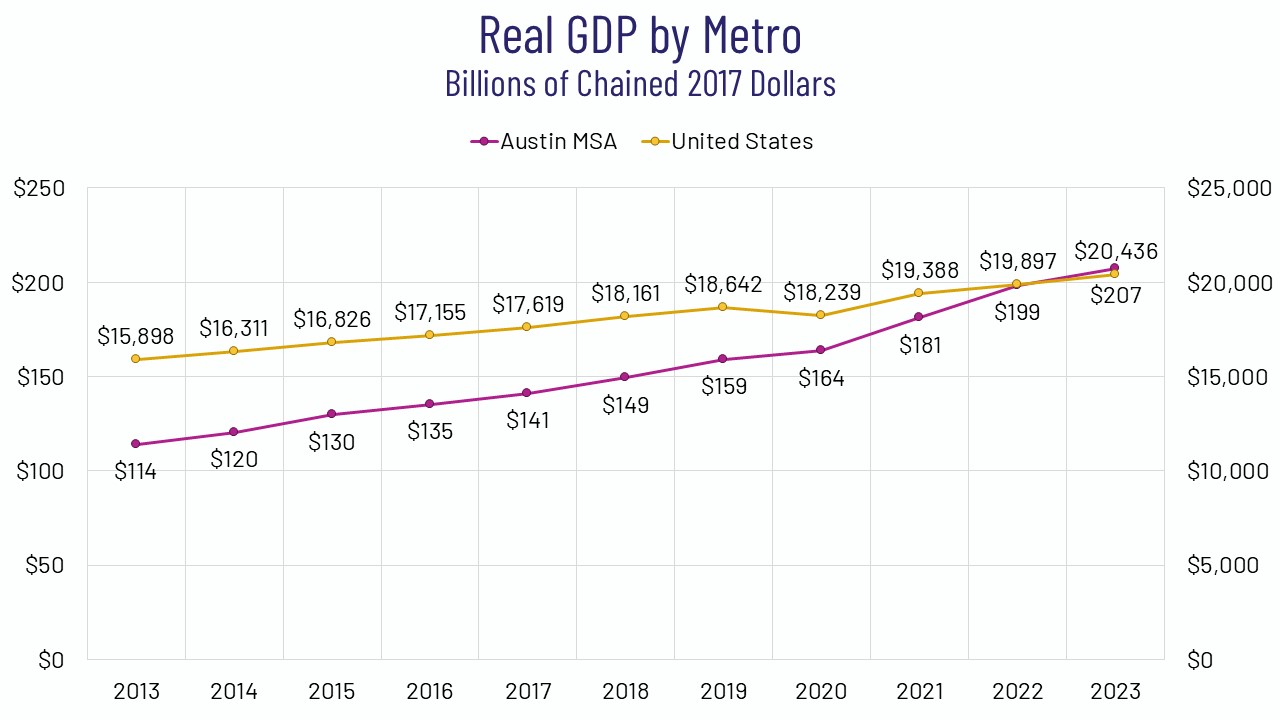
Austin’s economy grew 4.5% in 2023 according to new data on gross domestic product (GDP) by metro area and county released in December by the U.S. Bureau of Economic Analysis (BEA). The compound annual growth rate for 2018-2023 is 6.8%. These growth rates are real, inflation-adjusted, rates. GDP is the value of goods and services produced within a region less the value of goods and services used up in production.
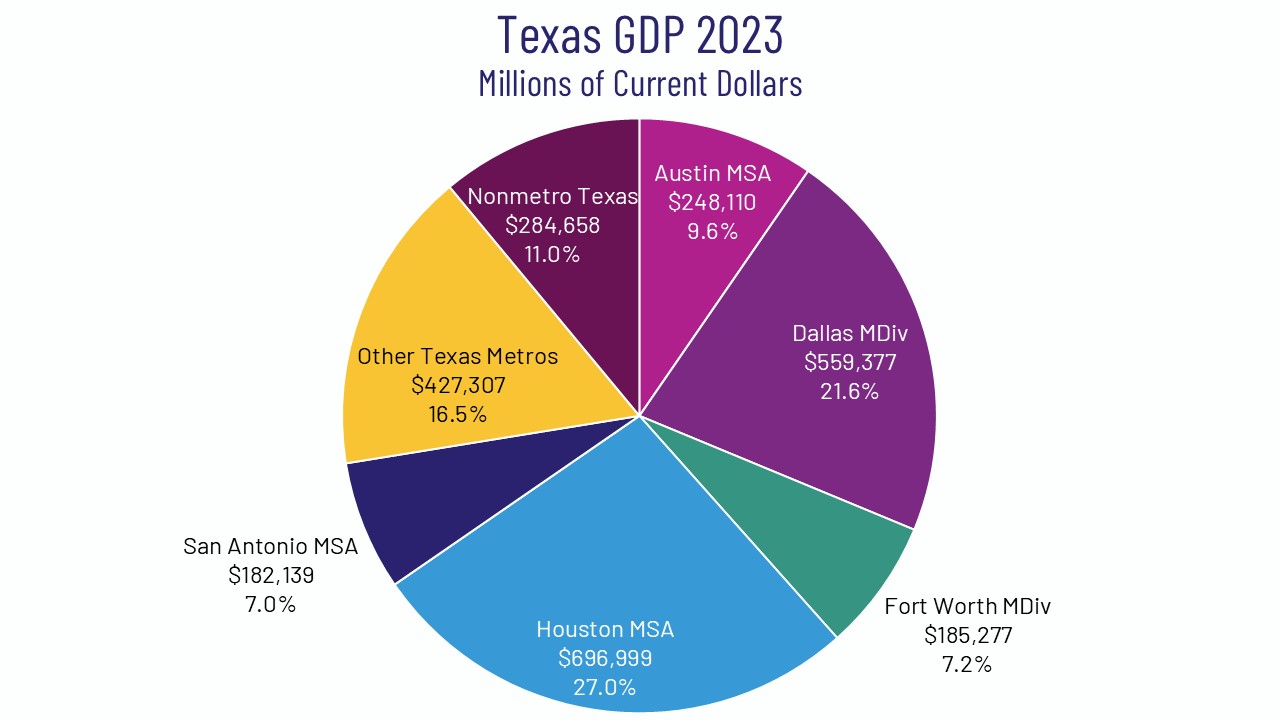
Austin’s current dollar GDP totals $248 billion in 2023, making it the 22nd largest U.S. metropolitan economy. On the basis of population in 2023, the Austin metro ranks 26th.
Economic contraction across U.S. metropolitan areas was widespread in 2020, with 77% of the 384 metros seeing negative growth. With the impact of COVID-19, GDP for the metropolitan portion of the U.S. fell by 2.2% in 2020. Among the top 50 largest metros, only 10 saw positive growth in 2020, with Austin ranking second behind San Jose.
Metro economies bounced back strongly in 2021. The metropolitan portion of the U.S. grew by 6.3% and Austin by 10.7%. Only 10, or 2.6%, of all metros saw negative growth. Among the top 50 metros, growth was uniformly positive.
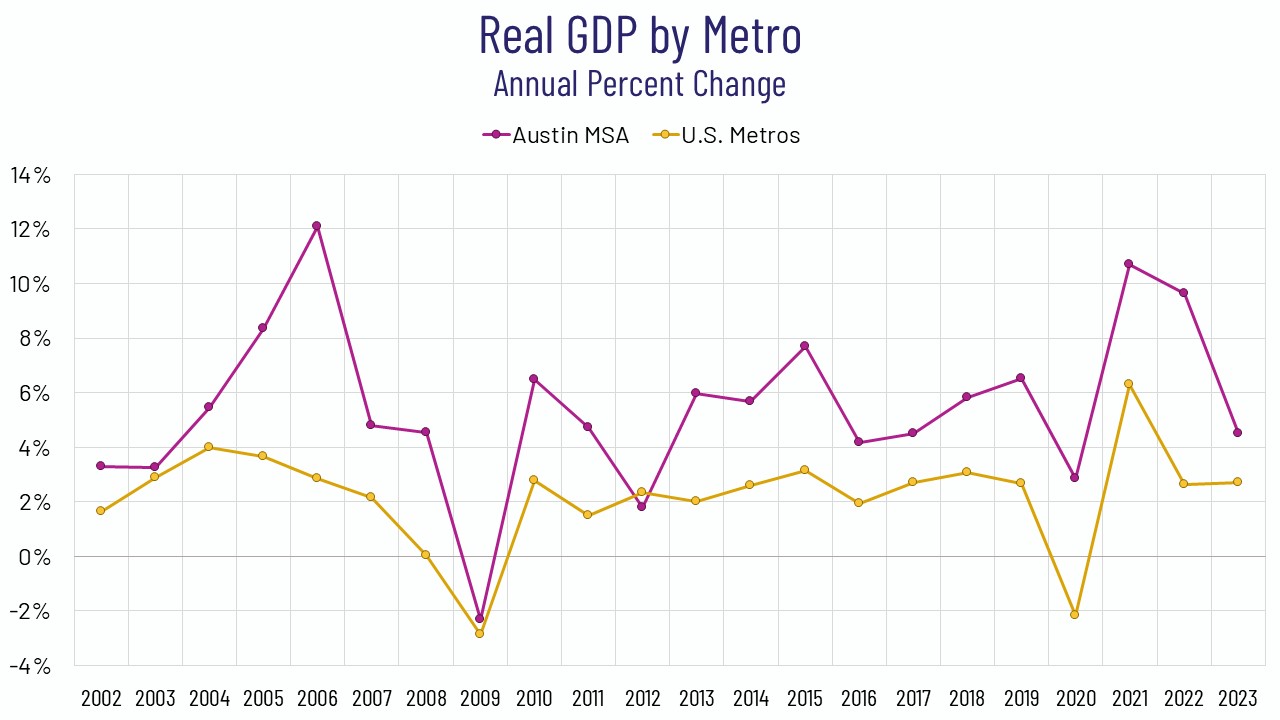
With economic growth in the metropolitan portion of the U.S. falling back in 2022 and 2023 (to 2.6% and 2.7% respectively) from what it was in 2021, 35 (9.1%) metro economies contracted in 2023. However, among the top 50, no metro areas saw negative growth. In aggregate, their growth was 2.9% in 2022 and 2.6% in 2023. The 50 largest metros account for over 71% of U.S. metropolitan area GDP in 2023.
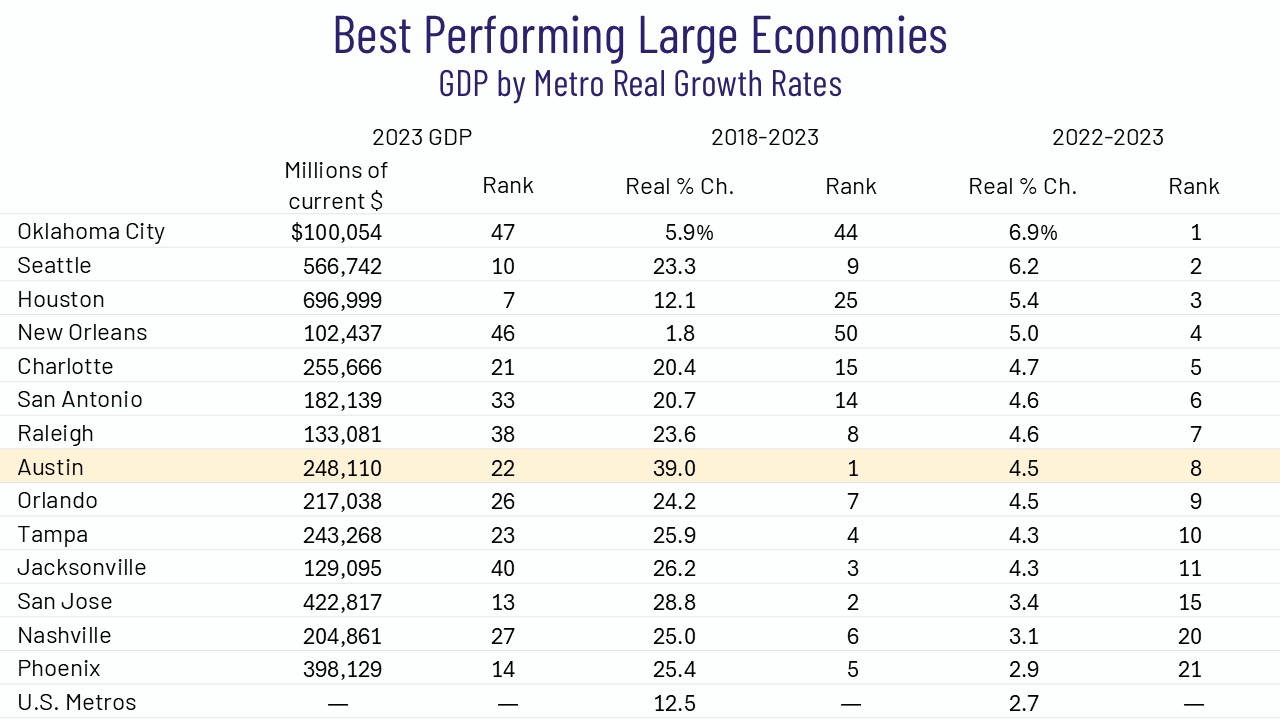
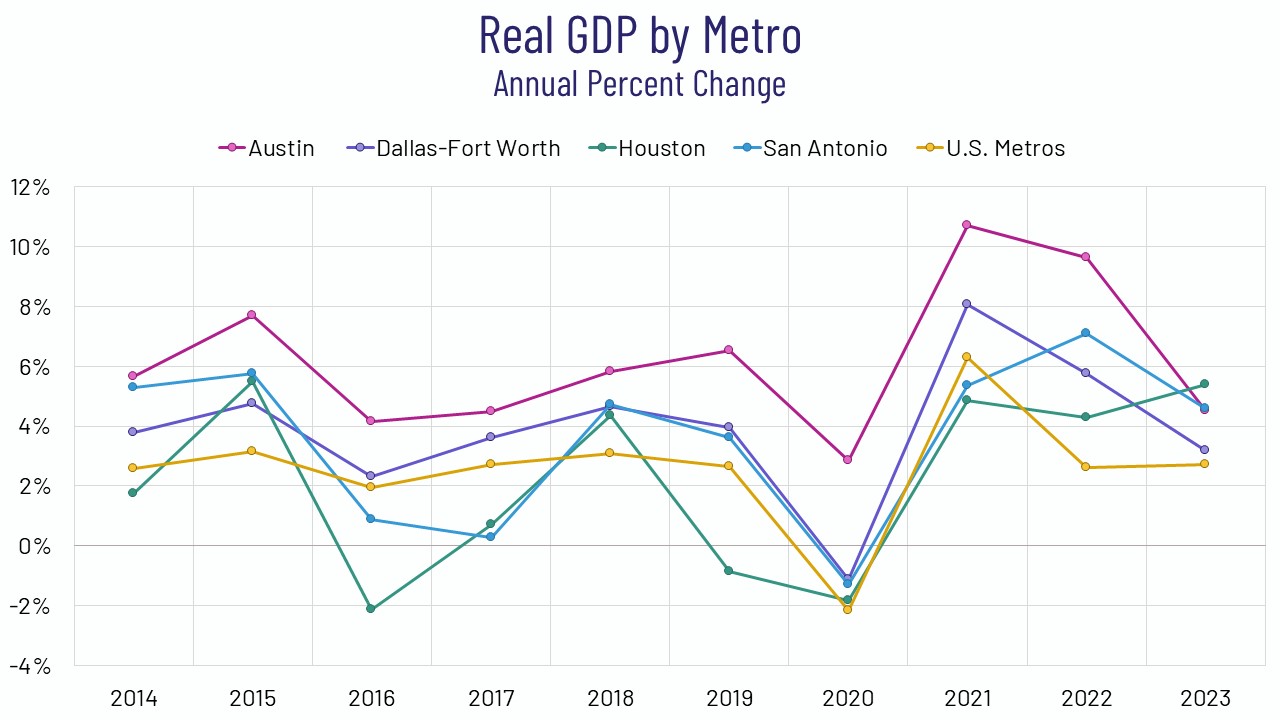
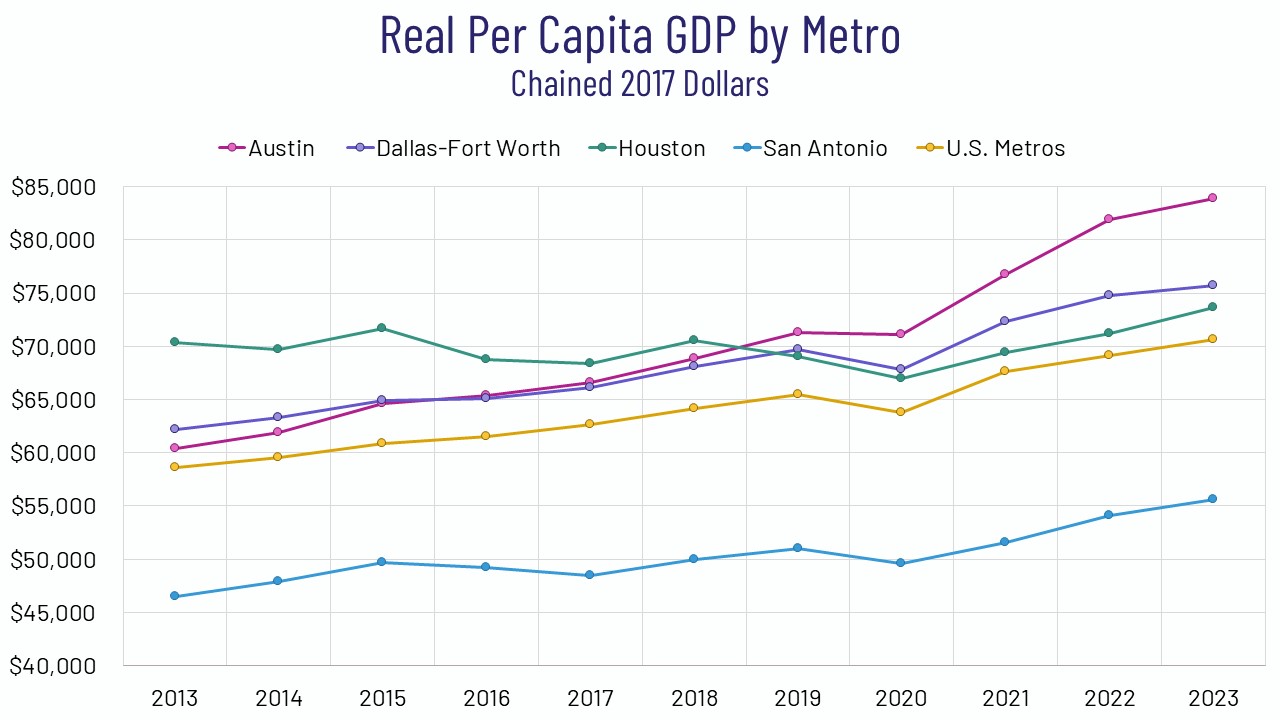
Austin’s 4.5% gain in real GDP makes it the eighth best performing among the 50 largest metro economies in 2023. Houston’s increase was 5.4%, ranking third, San Antonio gained 4.6%, ranking sixth, and Dallas-Ft. Worth grew by 3.2%, ranking 16th.
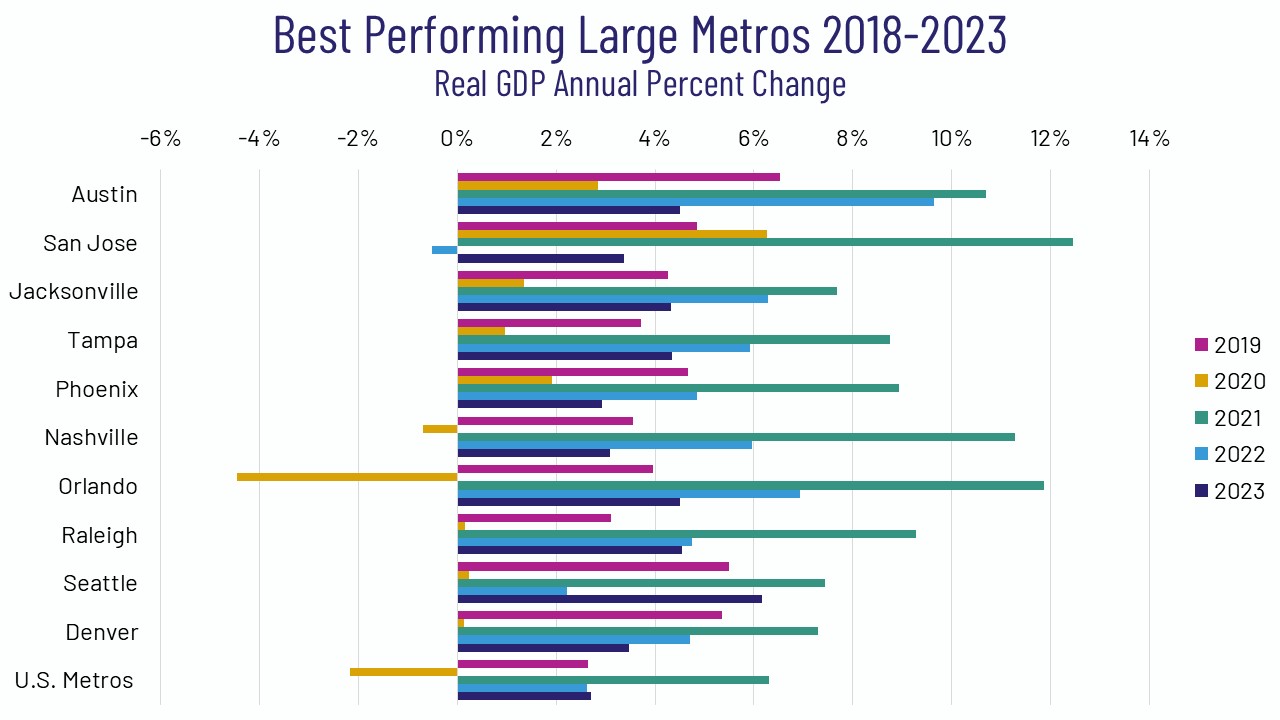
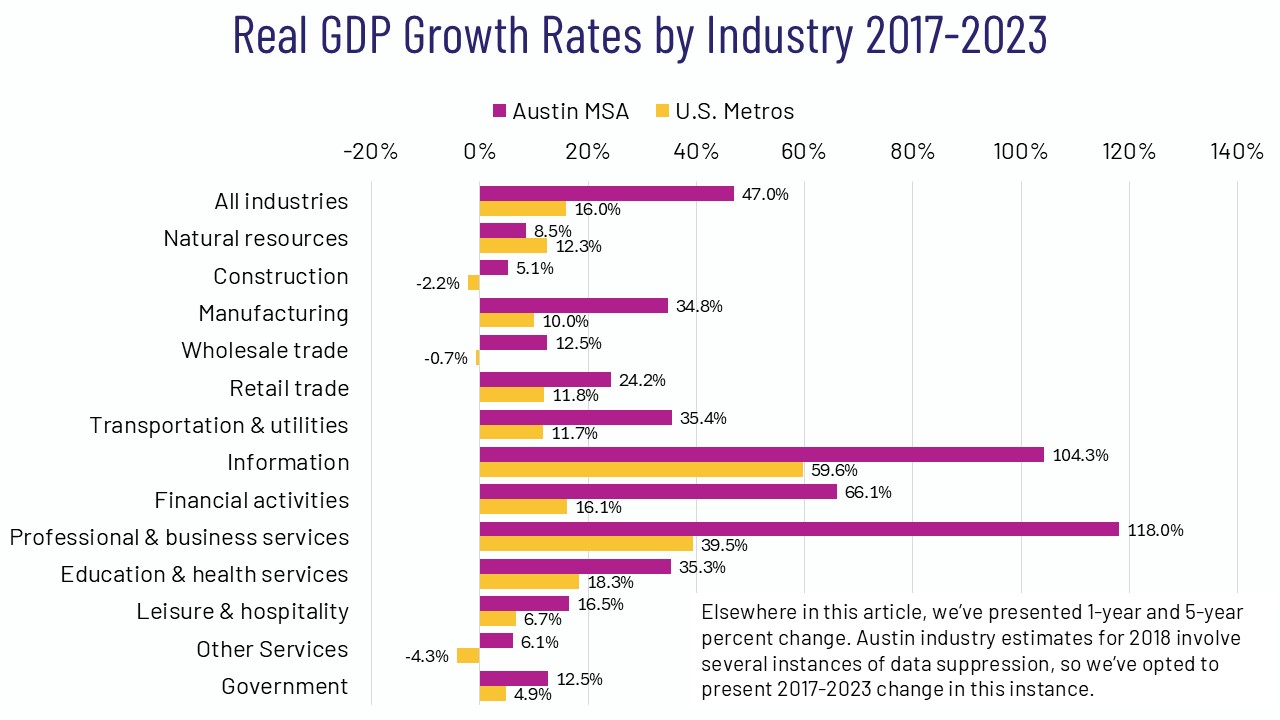
Over the last 5 years, real GDP is up 12.5% in the metropolitan portion of the U.S. In Austin, real GDP has grown 39.0% since 2018, making it the fastest growing major economy over this period. Dallas-Ft. Worth (up 21.2%), San Antonio (up 20.7%) and Houston (up 12.1%) rank as the 13th, 14th, and 25th best performing large metros for 2018-2023.
Per capita gdp
Austin’s real GDP on a per capita basis performed well relative to other large metros over 2018-2023 and 2022-2023. Austin ranks 20th, with 2.4% growth in real per capita GDP in 2023, while the gain across all metros was 2.2%. Houston’s increase was 3.4% (ranking fifth), San Antonio’s was 2.7% (14th), and Dallas-Ft. Worth’s increase was 1.2% (41st).
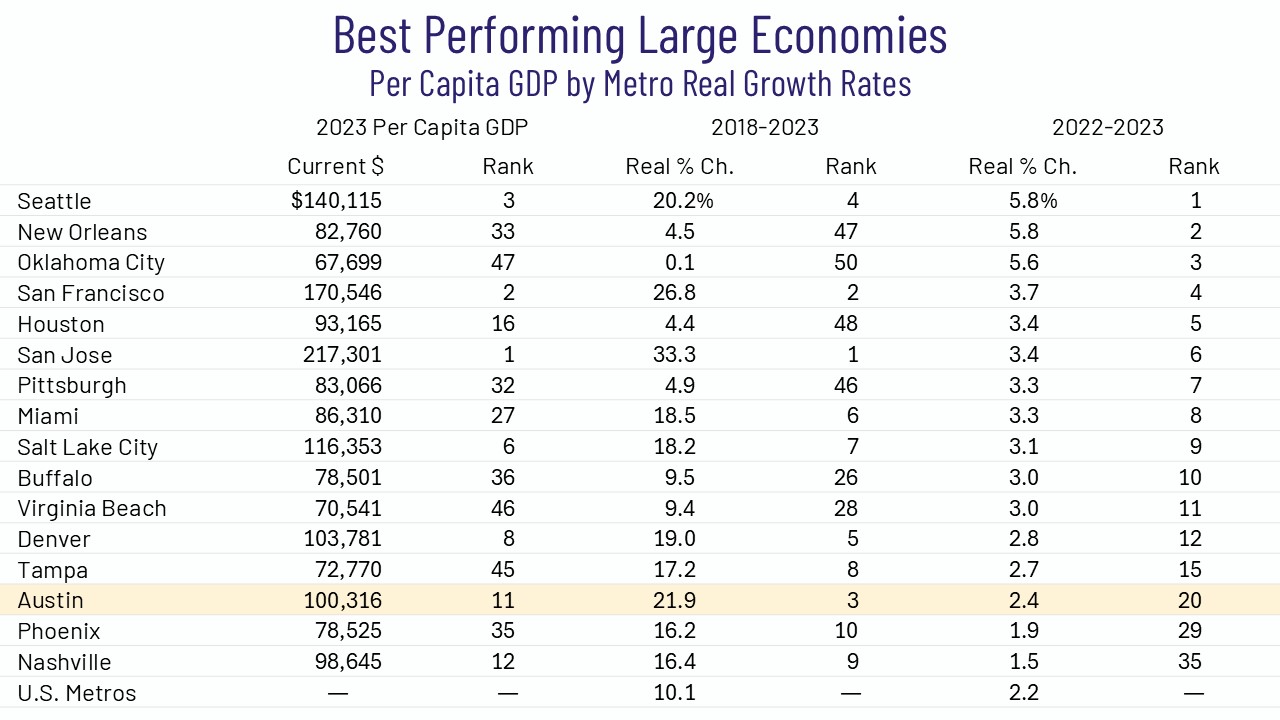
Since 2018, real per capita GDP is up 21.9% in Austin, making it the third best performing large metro. Across all metros, 2018-2023 growth was 10.1%. San Antonio’s increase is 11.3% (ranking 18th), Dallas-Ft. Worth is up 11.2% (19th), and Houston is up 4.4% (48th). Gains in real GDP on a per capita basis reflect improvement in an area’s standard of living.
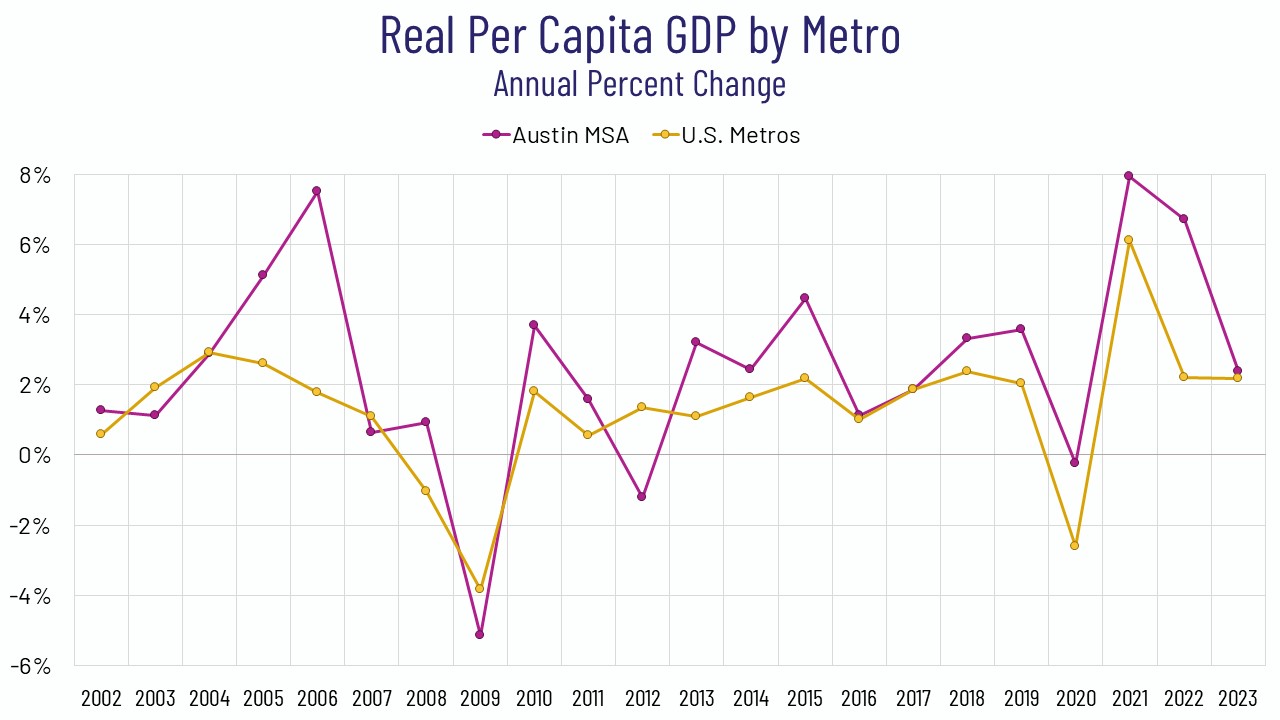
The impact of COVID-19 pandemic brought real GDP per capita down by 2.6% in 2020 in the metropolitan portion of the U.S. Among the top 50 metro economies, only San Francisco saw positive growth. Las Vegas’s decline of 10.0% was the largest. As of 2023, only one large metro, Oklahoma City, has yet to regain the level of per capita GDP it had in 2019.
GDP BY INDUSTRY
In Austin, where real GDP growth in 2023 was 4.5%, government and nine of eleven major private industries contributed positively to growth. Financial activities (1.12 percentage points) and professional and business services (1.09) contributed the most to growth. Construction and other services contributed negatively to growth (-0.12 combined).
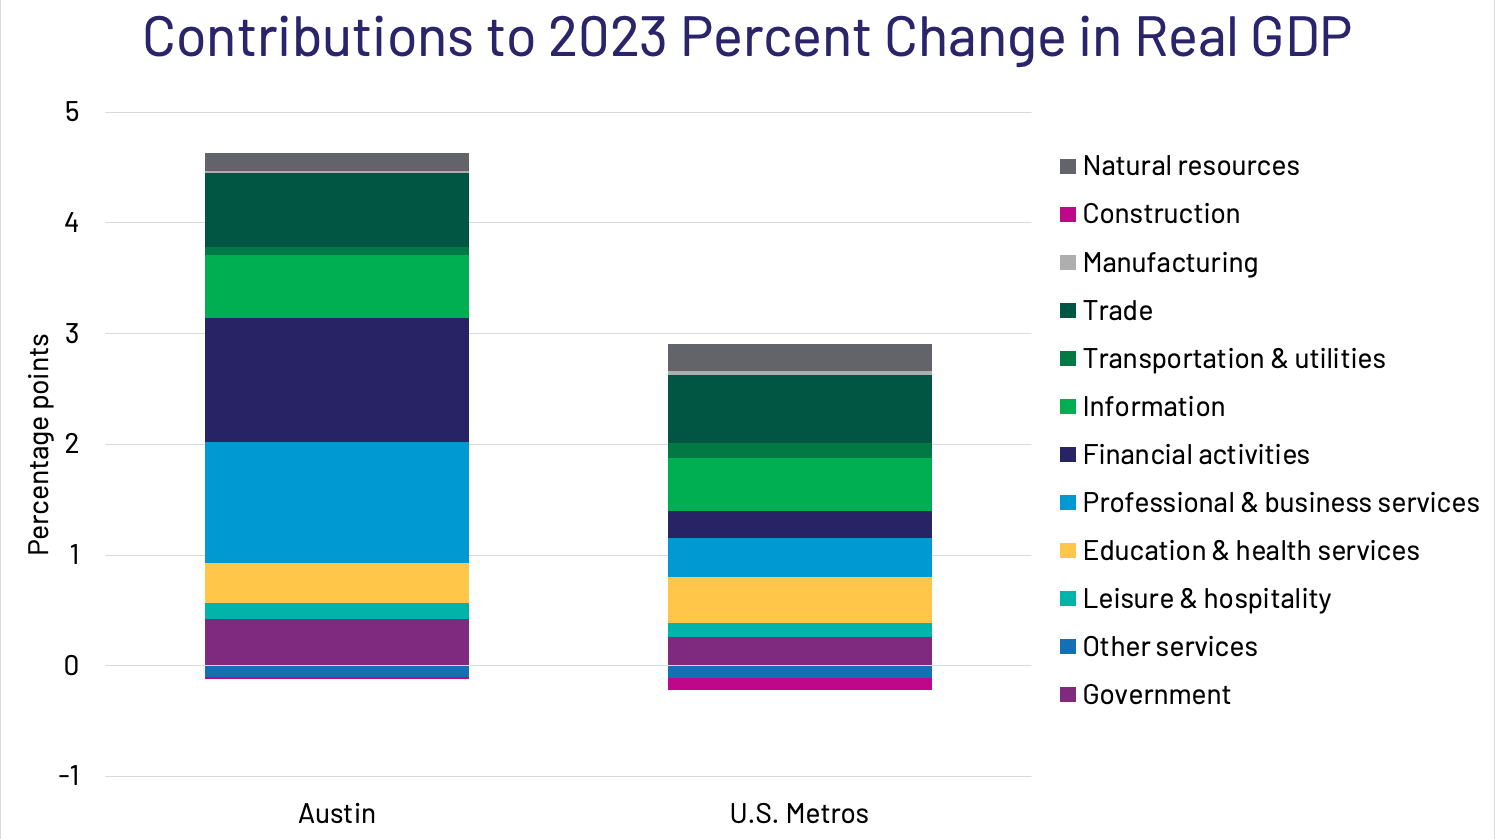
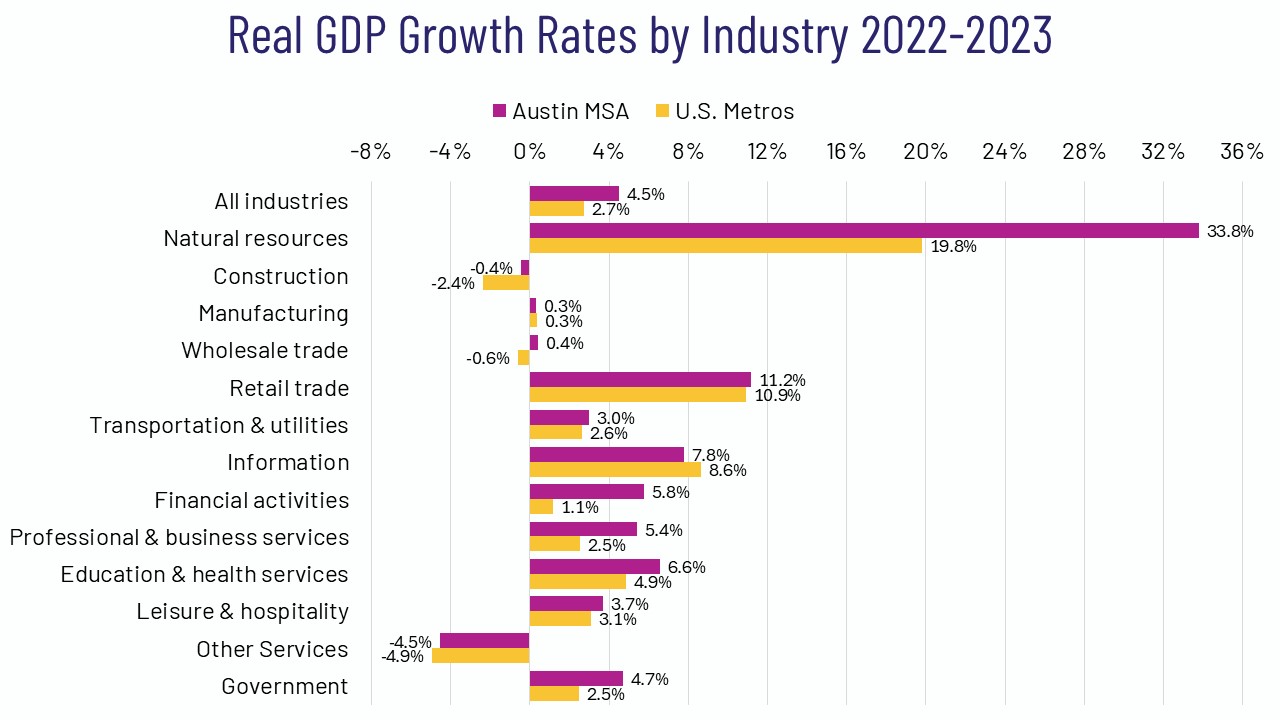
Professional and business services and financial activities are Austin’s largest industry sectors, each accounting for about 20% of 2023 GDP. Each saw between 5% and 6% real growth in 2023. Natural resources grew by 33.8%, but the industry accounts for less than 1% of the region’s GDP (making for a 0.16 percentage point contribution to growth). Trade accounts for 16.1% of Austin’s 2023 GDP and 4.1% real growth made that sector the third most significant contributor to growth (0.67). Almost all of this was due to retail trade which grew by 11.2% in 2023 while wholesale trade gained 0.4%.

The most significant major sector with negative growth in 2023 was other services, which contracted by 4.5%. The industry accounts for 2.1% of Austin’s 2023 GDP.
Nationally, trade was the sector contributing most significantly (0.62 percentage points) to the 2.7% real GDP change in the metropolitan portion of the U.S. Construction and other services provided the most significant negative contributions (both -0.11) to growth in 2023.
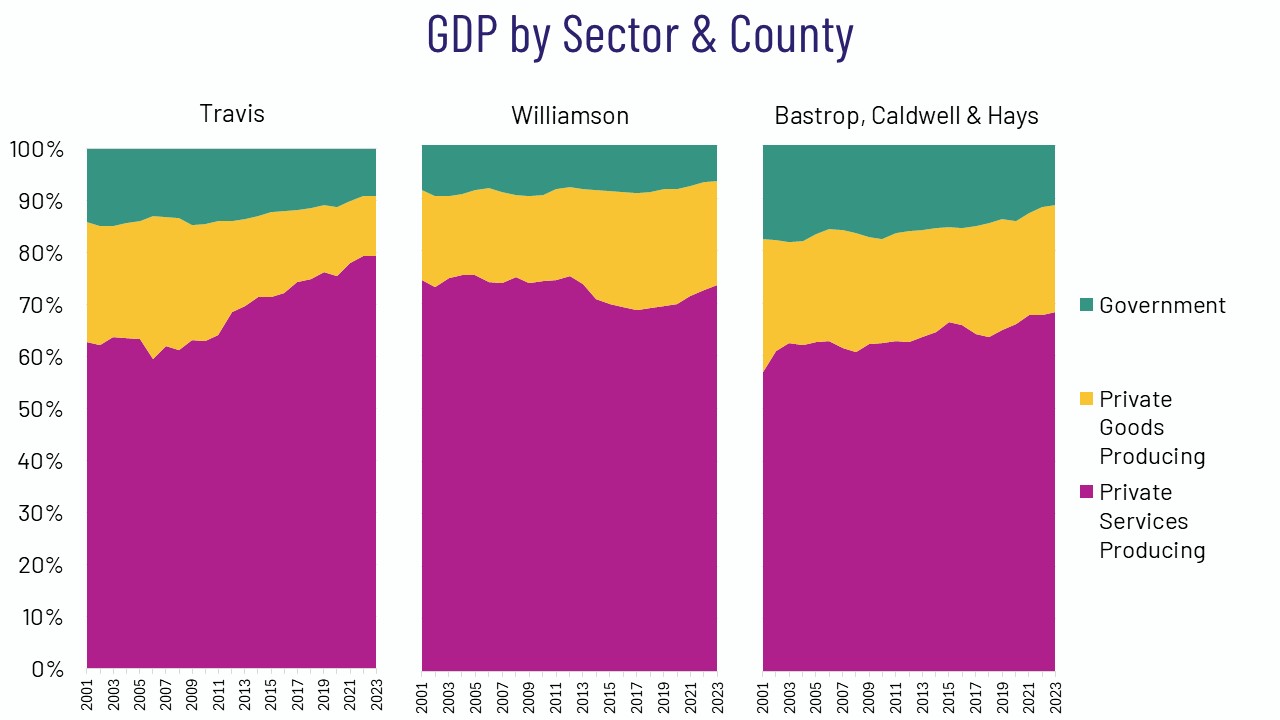
GDP BY COUNTY
Travis County’s $188 billion economy ranks as the 16th largest county economy in the nation. Harris County, TX ($542 billion) and Dallas County, TX ($366 billion) are in the nation’s top 10, ranking third and eighth, respectively.

Among the Austin MSA’s five counties, Hays County saw the fastest growth (7.9%) in real GDP in 2023. Among large counties, those with 500,000 or more population, Williamson County ranks as the second fastest growing in 2023 with 7.5% growth. Travis County’s 3.6% growth ranks 37th (out of 147 large counties). The fastest growing large county nationally is San Mateo, CA (7.7%).

Among the dozen large counties in Texas, Travis County’s $141,028 per capita GDP is the highest in 2023, followed by Dallas County’s $140,452. Travis County ranks 14th for per capita GDP among the 147 U.S. counties with 500,000 or more population. New York County, NY, followed by San Francisco County, CA, have the highest per capita GDP among large counties ($587,808 and $325,232 respectively). Hidalgo County, TX has the lowest per capita GDP ($33,641) among large U.S. counties.
Travis County’s 3.6% real growth in 2023 was driven by professional and business services (1.05 percentage points) and information (0.70).
Financial activities was the leading contributor to Williamson County’s 7.5% GDP growth in 2023, accounting for 3.83 percentage points. Professional and business services (1.58) and retail trade (0.96) were the next most significant contributors. Manufacturing (-0.27) provided the most significant negative contribution.
Financial activities (2.53), retail trade (1.24), and manufacturing (1.21) were the most significant contributors to Hays County’s 7.9% real GDP growth in 2023.
 Conclusion
Austin’s economy performed well in 2023 according to last month’s annual release of GDP by metro by the U.S. Bureau of Economic Analysis. It ranked in the top 10 for real, inflation-adjusted growth (4.5%) over the last year among the 50 largest metro economies. However, longer range growth was more robust, with Austin ranking first for real growth over the last five years (39.0%). Real GDP measured on a per capita basis was strong as well. Among large metros, Austin’s 2.4% growth over the last year ranks 20th, while its 21.9% gain in real GDP per capita over the last five years ranks third.
Austin’s current dollar GDP totals $248 billion in 2023, making it the 22nd largest U.S. metropolitan economy. In 2023, Austin’s per capita GDP is $100,316, ranking 11th among large metros.

