The Austin economy
For our November Economic Indicators report, you’ll notice a slightly shorter version. This is due to the lack of new data released for many of our indicators while the Federal government is shutdown. The only Federal dataset released was a specially authorized update of the Consumer Price Index published by the Bureau of Labor Statistics. One key non-Federal release this month was 3rd quarter Venture Capital numbers showing impressive investment in the Austin innovation ecosystem.
- Austin companies raised $3.2B in VC funding in Q3 2025, which is likely the single best quarter in Austin’s history.
- VC funding YTD ranks 5th nationwide at $6.8B, surpassing the annual amount raised in Austin for all years except 2021.
- Passenger traffic at AUS airport increased by 47,265 in August 2025 over the same time last year, which is the equivalent of adding 270 full flights. August 2025 was the third busiest August on record behind 2022 & 2023.
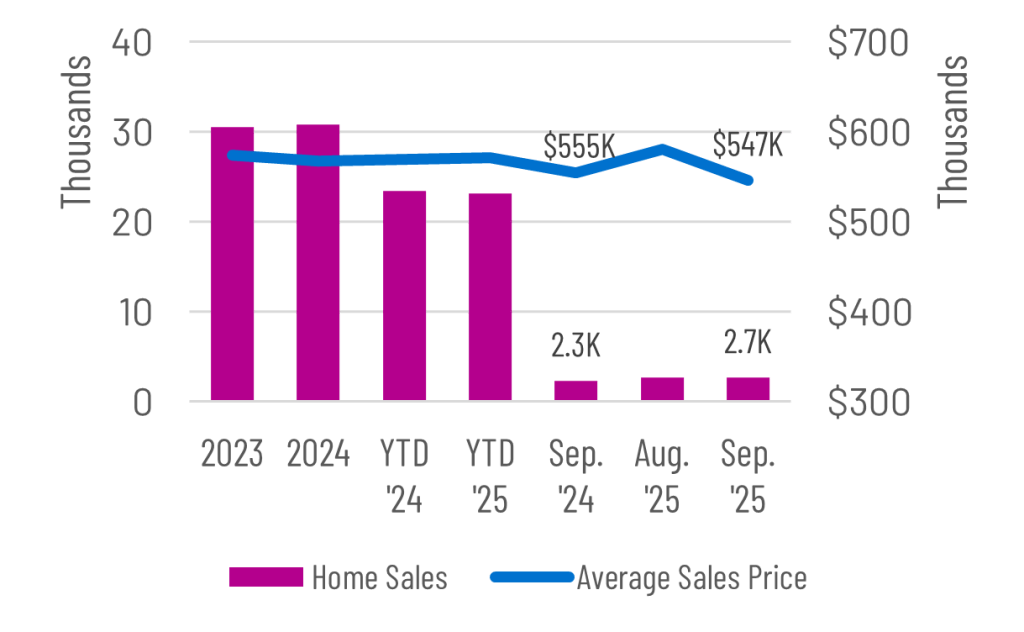
- September regional home sales totaled 2,677, up 16.2% from 2,303 in Sep. 2024. The average home price in September 2025 dropped to $547K from $555K during the same time last year.
Venture Capital Investment
Venture Capital funding in Austin in 2025 through Q3 totaled $6.8 billion, almost topping Austin’s best VC year ever (2021 at $7.3B). In Q3 alone, Austin companies brought in $3.24 billion. Highlighting Austin’s spectacular performance this quarter is the fact that Austin’s share of US VC funding was an impressive 4.0%, up from the typical 2.1% averaged since COVID.
The Austin region ranked fifth nationwide for VC funding in 2025, behind the CA Bay Area, $146.1B; NYC, $30B; LA, $14.7B; and Boston, $9.6B. Austin usually ranks sixth or seventh often trading places with Seattle & Washington DC.
The top five funding rounds for 2025 Q3 include: Base Power, $1B; Anaconda, $150M; Harbor Health, $130M; Overhaul, $105M; and Aalo Atomics, $100M.
Source: Pitchbook.

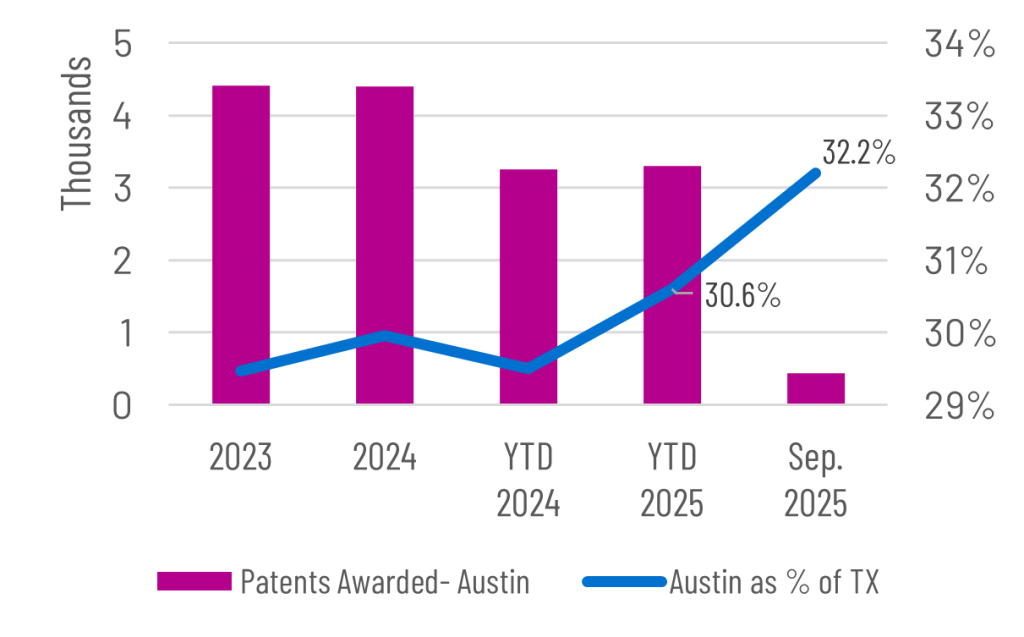
Patent Activity
Austin inventors are averaging an impressive 4,500 patents awarded each year during the 2020’s, which is higher than the 3,750 averaged during the 2010’s. Patent activity in Sep. 2025 increased to 443 from 332 during the same month last year. Patent activity YTD is up 1.7% to 3,306 in 2025.
Austin continues to represent approximately 30% of patent activity in TX. This is a truly remarkable data point since the Austin MSA only represents around 8% of the entire population of the State. Patent activity statewide is down 1.9% from 11,008 in 2024 YTD compared to 10,797 YTD 2025.
Source:U.S. Patent & Trademark Office.
AUS Airport Passenger Activity
Annual passenger counts through the Austin airport hit a record 22.1 million in 2023 and fell 1.5% in 2024. Through Aug. 2025, YTD totals at 14.14M are slightly down from the same time last year at 14.59M. August 2025 was the 3rd busiest August of all time with 1.773 million passengers, up 47,265 passengers or 2.7% from Aug. 2024 (the equivalent of adding 270 full flights).
Total cargo (including Belly freight, cargo and mail) totaled 301.9 million pounds in 2024, up 6.7% from 283.1 million pounds in 2023. The annual record for total cargo occurred in 2022 with 310.1 million pounds transported. For Aug. 2025, YTD cargo totaled 181.0 million pounds, which was a 10.8% decrease from the same time last year.
Source: City of Austin, Dept. of Aviation

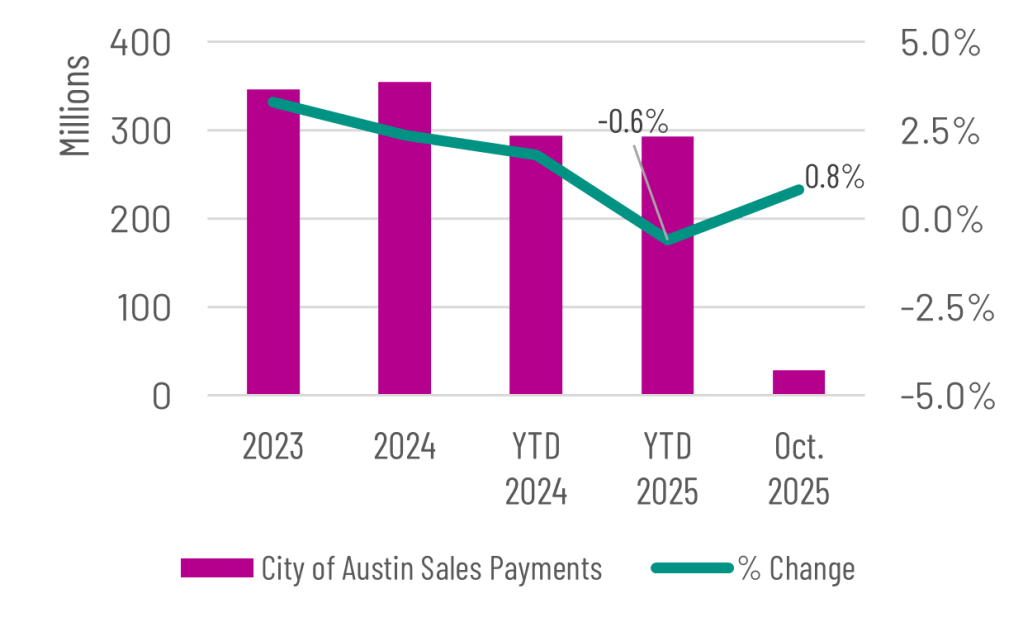
Sales Tax Receipts
Sales tax allocation payments to the City of Austin grew 3.3% in 2023 and 2.4% in 2024. So far year to date through October 2025, receipts are down by 0.6% compared to the same time last year. Payments to Austin were $28.5M in October 2025, up 0.8% from the same month last year.
In Round Rock, receipts were up 1.4% in 2023 and down 1.4% in 2024, San Marcos received 4.2% more funds from sales tax payments in 2023 and 2.1% less in 2024. For Oct. YTD, Round Rock’s sales are up 10.6% from 2024 YTD and San Marcos was down -0.2%. Statewide, Oct. 2025 YTD sales tax collections are up 4.2% compared to YTD 2024.
Source: Texas Comptroller
Home Sales
Home sales in the Austin region peaked at 41,094 in 2021. For the last two years, total sales were about 30,500. In September, YTD sales are down by about 350 or 1.5% compared to the same time last year. Statewide, YTD sales in Sep. were up 1.7% compared to 2024, while U.S. sales were down 0.2%.
The average sales price in the Austin region was $546,581 in Sep. 2025, down from $554,547 one year ago, while YTD the avg, sales price at $571K is up about $1K from 2024. In Sep. 2025, months on inventory in Austin was 5.4 months, down from a peak of 5.9 this summer. Months of inventory is almost 1 month higher than last year.
Source: TX A&M Real Estate Research Center
Consumer Price Index
After reaching a 40-year high of 8.0% in the annual percent change in 2022, the U.S. Consumer Price Index fell to 4.1% in 2023 and 2.9% in 2024. Year over Year change in Sep. 2025 was 3.0%, slightly higher than the 2025 YTD increase of 2.7%.
While a CPI is not produced for the Austin metro, the Dallas metro index was up 1.9% in September over the same time last year, while the Houston metro index was up only 1.1% in August 2025. The CPI index for these two areas are only produced every other month. Some of the biggest contributors nationwide to increasing inflation in the Index were Natural Gas, up 11.7%; Electricity, up 5.1%; Medical Services, up 3.9%; Shelter, up 3.6%; and Food, up 3.0%.
Source:U.S. BLS, CPI

Upcoming Releases
Opportunity Austin will continue to update economic indicators and will return to the normal range of statistics including job growth, unemployment & housing permits once the Federal government resumes normal data releases. Just before the Federal shutdown, the Census Bureau released intercensal population estimates, which revised population growth between 2010 to 2020 using data collected from the Census 2020. Additionally, the Texas Demographic Center recently released projections for population of Texas counties through 2060. Later this month, we’ll have a special By the Numbers post focused on these two datasets. Stay tuned.
More Info & downloads
- Labor force, employment & unemployment
- Employees on nonfarm payrolls
- Hours & earnings
- Consumer price index
- Metro business cycle index
- Sales tax & retail sales
- Housing permits
- Home sales, listings & prices
- Air service
- Patent activity
- Commercial real estate
For questions about this data, please contact Chris Ramser, Vice President, Research (512.322.5662) or Joseph Morones, Director, Research.