
Insights
- Austin is the 4th best performing among the top 50 metros, adding 35,600 jobs, 2.7% growth, in the year ending in January.
- The fastest job growth over the last 12 months occurred in Austin’s construction and natural resources (7.4%) and other services (7.3%) industries.
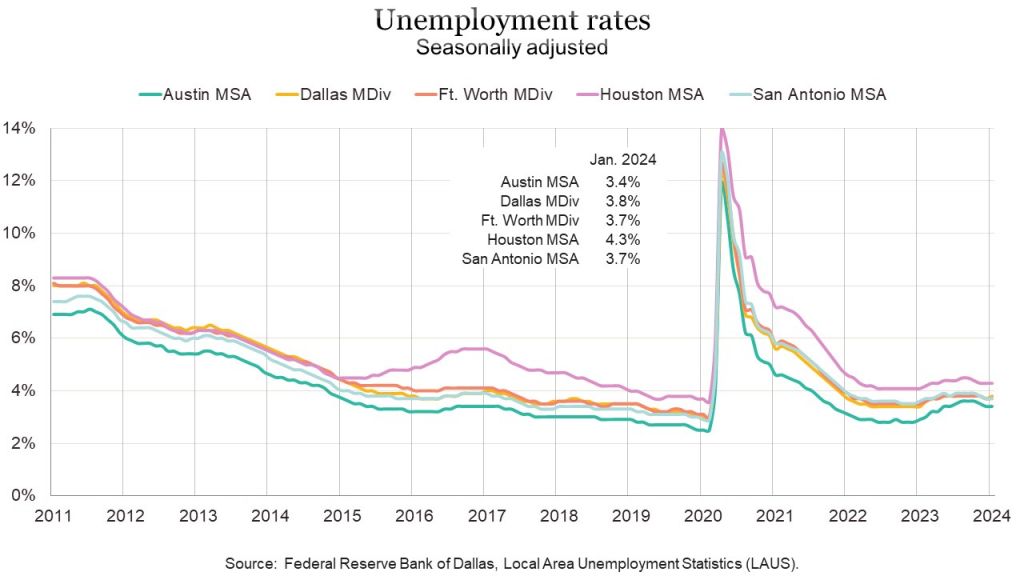
- Austin’s seasonally adjusted unemployment rate held steady at 3.4% in January.
Nonfarm payroll jobs
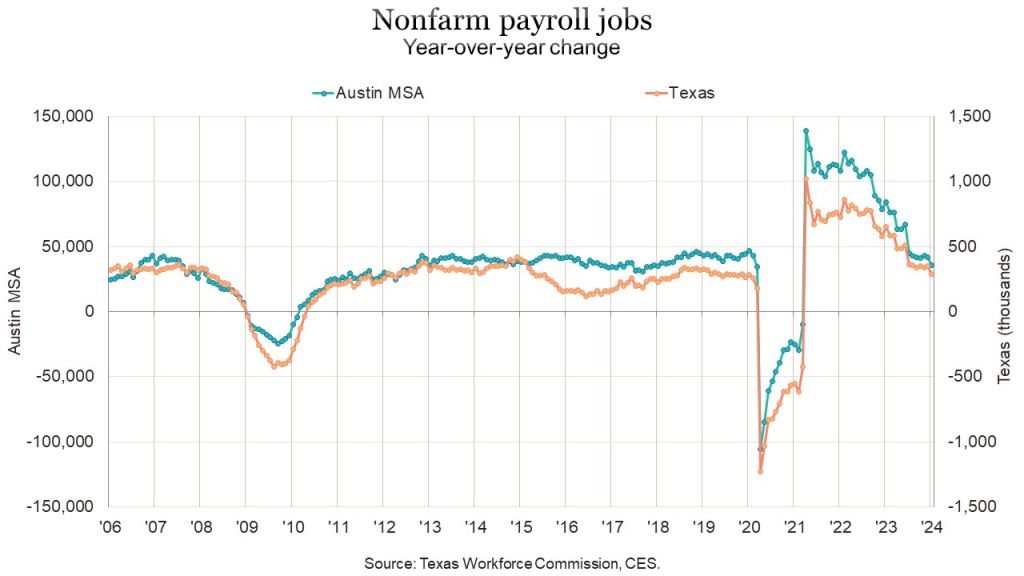
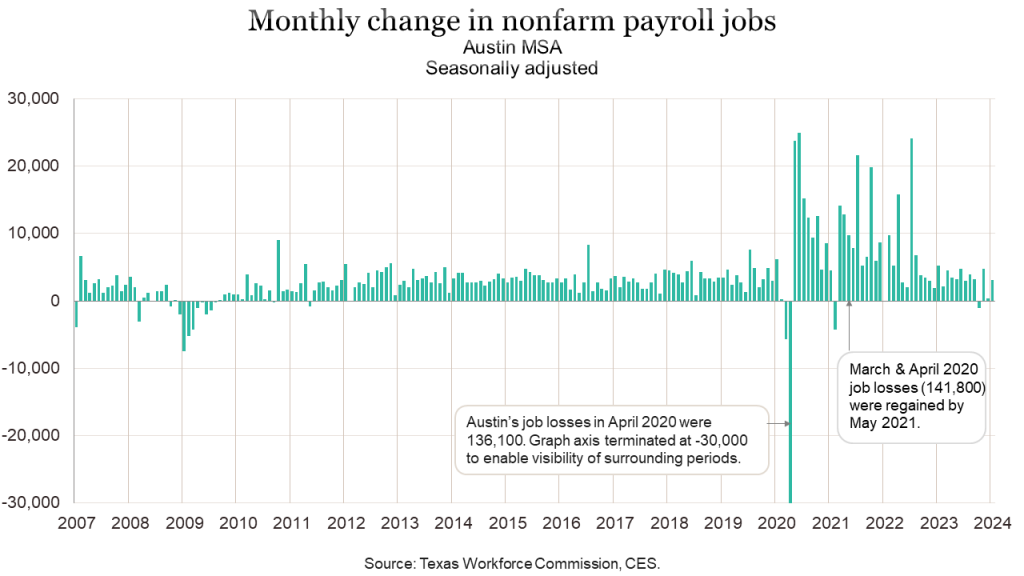
Austin’s January nonfarm payroll jobs total is up by 35,600, or 2.7%, over the last 12 months according to this week’s releases of monthly labor market data by the Texas Workforce Commission and the U.S. Bureau of Labor Statistics. On a seasonally adjusted basis, Austin jobs increased by 3,100 or 0.2% from December to January.

Austin’s year-over-year increase of 2.7% makes it the 4th best performing among the 50 largest metro areas. San Antonio (2.7%) and Houston (2.5%) also rank in the top 10. Fort Worth (2.1%) and Dallas (1.7%) rank 13th and 20th respectively.

March is the month in which benchmark revisions are applied to previously published labor market estimates. Statewide, job creation in 2023 was revised downward from 2.9% to 2.5%, but in Austin job growth was faster in 2023 than preliminary estimates indicated. Instead of creating 32,800 jobs (2.5%), revisions indicate that Austin created 41,800 jobs (3.2%) in 2023.
For the year ending in January, private sector job growth in the Austin MSA is 2.8%, or 31,500 jobs, with gains across 10 of the 11 major private industry sectors. Total job growth was 2.7% as the government sector, which accounts for 15% of metro area employment, grew by a more moderate 2.1%.
Texas saw net private sector job growth of 2.0% with nine of the 11 private industry groups adding jobs over the last 12 months. Total job growth was 2.1% as the government sector grew at a robust 3.1% rate. For the nation, private sector job growth was 1.8% for the 12 months ending in January with all but two private industries adding jobs. Overall job growth was slightly higher at 1.9%, due to relatively robust 2.7% government sector growth.

Jobs in January are down by 17,500 or 1.3% from December in the not-seasonally-adjusted series for Austin. However, the seasonally adjusted series shows positive job growth with a gain of 3,100 jobs or 0.2%. Seasonally adjusted jobs are up in Fort Worth (0.1%) and Houston (0.2%), but down in San Antonio (-0.2%) and Dallas (-0.3%). Statewide, seasonally adjusted jobs are up by 18,900 or 0.1%. Nationally, seasonally adjusted jobs are up from December by 229,000 or 0.1%.
In Austin, 10 of the 11 major private industry sectors added jobs over the last 12 months. Construction and natural resources is the fastest growing (7.4% or 5,900 jobs) and education and health services (5.2% or 7,700) added the most jobs. Other services was also fast growing (7.3% or 3,600). The large professional and business services industry is commonly the industry adding the most jobs and one of the fastest growing in Austin, but over the last year, thats not the case, and the industry’s employment is essentially unchanged (up by only 100 jobs) from January of last year. Information saw negative year-over-year growth (-3.7% or -2,000).
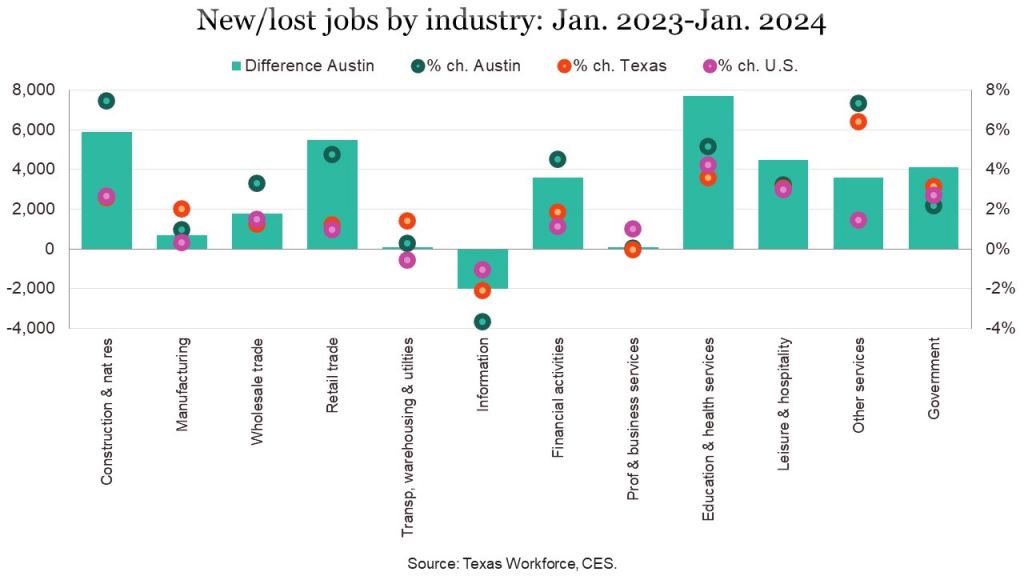
Statewide, over the last 12 months, nine of the 11 private industries added jobs. The industries with the most significant growth are other services (6.4%) and education and health services (3.6%). Information and professional and business services jobs declined (by 2.1% and 0.1% respectively).
Nationally, all private industries except two, added jobs over the 12 months ending in January, led by education and health services (up 4.2%) and leisure and hospitality (3.0%). Information (-1.1%) and transportation, warehousing and utilities (-0.6%) lost jobs.

Over the last 12 months, the net gain for private service-providing industries in Austin is 24,900 jobs, or 2.6%. Employment in goods-producing industries is up by 6,600 jobs or 4.3%. Statewide, private service-providing industries are up 182,700 or 1.9%, and goods-producing industries are up 44,400 or 2.3%.
Additional graphs: New/lost jobs by industry for Dec. 2023-Jan. 2024 and the trend since 2000 for six large industries and six small industries.
Labor force, employment & unemployment
We also now have January labor force, employment, and unemployment numbers for Texas and local areas in Texas. The same data for all U.S. metros will not be released by the U.S. Bureau of Labor Statistics until March 13. In December, Austin had the 19th lowest rate of unemployment among the 50 largest metros. Unemployment numbers for January show Austin’s performance relative to the state and other major Texas metros being sustained.
In January, Austin’s not-seasonally-adjusted unemployment rate is 3.4%, which is an increase of 0.1 percentage points above where it was one year ago (3.3%). Rates in the other major Texas metros range from 3.8% in San Antonio to 4.4% in Houston. Fort Worth is unchanged and Dallas’ rate is 0.1 percentage points higher than last year. Houston’s and San Antonio’s current rates are 0.1 to 0.2 percentage points below the rates one year ago. The statewide rate is now 4.1%, improved from 4.3% in January of last year. The national unemployment rate is also 4.1%, up from 3.9% a year ago.
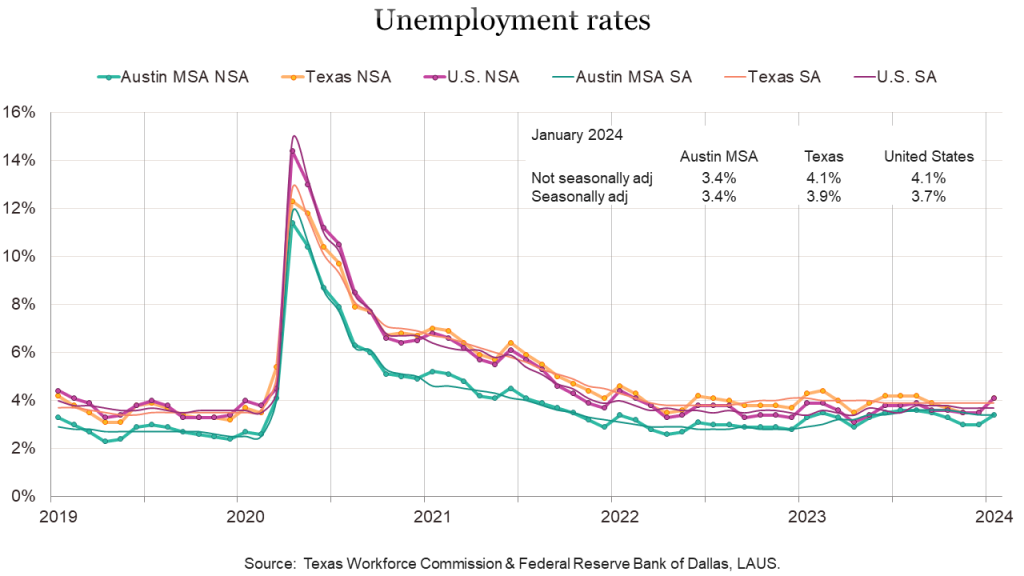
January unemployment rates are 3.4% in Bastrop, Hays, and Travis Counties, and 3.6% in Williamson County and 3.7% in Caldwell County.
On a seasonally adjusted basis, Austin’s January unemployment rate is 3.4%, the statewide rate is 3.9% and the national rate is 3.7%, each unchanged from December.
Among Texas’ other major metros, Fort Worth and San Antonio are at 3.7%, Dallas is at 3.8%, and Houston is at 4.3%. Seasonally adjusted unemployment rates for Texas metros are produced by the Federal Reserve Bank of Dallas. (The Texas Workforce Commission also produces seasonally adjusted rates for Texas metros, but publication lags the Dallas Fed’s estimates.)
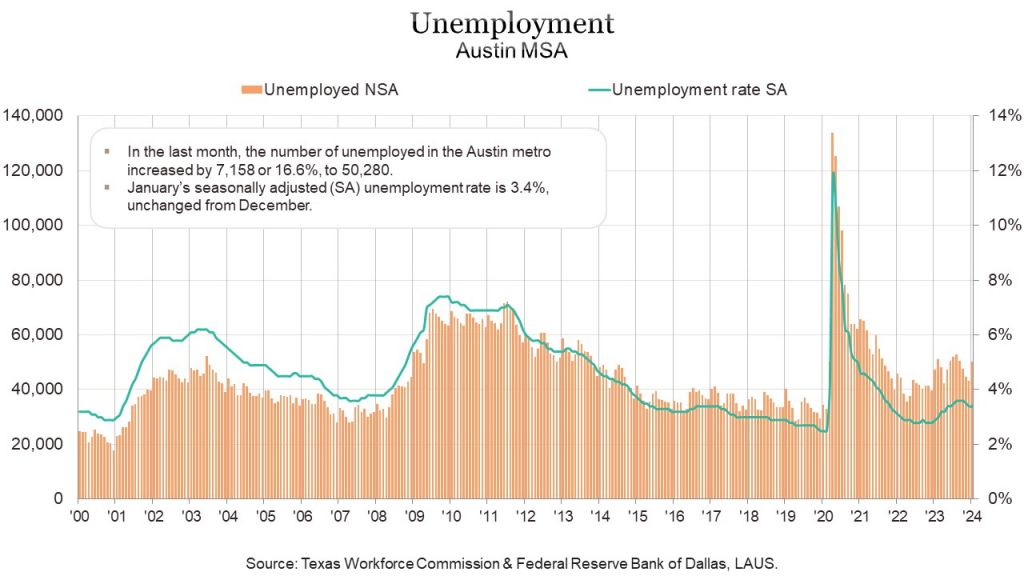
With Austin’s unemployment rate up from one year ago, the number unemployed has also risen. In January 2023, Austin’s number of unemployed was 47,271. Over the last 12 months, the unemployed increased by 3,009 or 6.4%, to 50,280. This is due to a larger increase in the labor force, compared to the number employed. The Austin metro’s civilian labor force (employed plus unemployed) increased by 36,824 persons or 2.6% from one year ago, while persons employed increased by 33,815 or 2.4%.

Additional graphs: Labor force & employment: Texas and United States
Texas’ labor force growth (263,958 or 1.8%) over the last 12 months is less than the growth in the number employed (279,106 or 2.0%). Thus, the number of unemployed decreased by 15,148 or 2.4%. Nationally, January civilian labor force is up by 1.4 million or 0.8%, while the number of employed is above the level of a year ago by 1.0 million or 0.6%, and 400,000 more people (6.3%) are unemployed.


Conclusion
Recent months have seen Austin’s and Texas’ job growth slow. Austin’s year-over-year (YOY) job growth averaged 5.7% in the first half of the year, then 3.3% in the second half of 2023. That slowing continues with YOY growth falling to 2.7% in January. Nevertheless, Austin achieved stronger growth than all but 3 of the 50 largest metros for the 12 months ending in January.
For Texas, growth averaged 4.1% in the first six months of 2023, followed by an average of 2.6% for the last six months of the year. As in Austin, the state YOY job growth falls to a new low of 2.1% in January. In Friday’s Texas Employment Forecast, Dallas Fed senior business economist Luis Torres commented that Texas employment growth seems to be returning to its long-term growth rate. The current forecast indicates Texas jobs will increase 2.2% in 2024.
The Texas Workforce Commission and the U.S. Bureau of Labor Statistics will release February estimates on March 22.
###
Until recently, this monthly article on the labor market releases included tracking of the pandemic recovery in Austin. While the fullness of recovery varies from industry to industry, and the unemployment rate remains above 2019’s average, Austin is otherwise securely recovered from the pandemic. Therefore, we are reverting to our customary focus on month-over-month and year-over-year trends. If you would like to review post-pandemic performance, the last article that included observations of this is October 2023. The CES and LAUS spreadsheet files on our Economic Indicators page will continue to include change from the last pre-pandemic month to the current month.
