
The Austin economy
With the reopening of the Federal government, the statistical agencies have resumed collecting data for their surveys, however, the release schedules will not return to a normal cadence until early 2026. National jobs and unemployment stats were released for September, but no information was published for State and Metro areas. Data collection for October did not occur, so no October numbers are expected. September Metro level employment stats will be released on December 17th. As a result, our indicators report for December 2025 is again a shorter format including only data that was updated.
- National Year-over-Year job creation for September totaled 1.2 million jobs, representing growth of 0.8%. The national unemployment rate stood at 4.3%, up from 3.9% in September 2024.
- The AUS airport had its busiest month ever with 2.086M passengers in October 2025, surpassing the previous record of 2.068M in May 2024. Total passengers in October 2025 were up 8.9% over October 2024.
- Sales tax receipts in the City of Austin increased 4.1% for November 2025 compared to the same month last year.
- YTD home sales through Oct. 2025 are down 425 sales from last year, but avg. home price inched up to $572.5K.
National Employment Situation
Nationally, over the last 12 months the U.S. added 1.2 million jobs through September 2025 at a rate of growth of 0.8%. This level of growth trails slightly the pattern experienced from 2023 to 2024 when growth was at 1.3%. Industries experiencing faster growth included, Education & Health Services, 3.0%; Leisure & Hospitality, 1.3%; and Other Services, 1.2%. Areas experiencing declines included: Manufacturing, -0.7%; Professional & Biz. Services, -0.4%; and Information, -0.2%.
The unemployment rate nationally was 4.3% in Sept. 2025, up from 3.9% one year ago. With the unemployment rate higher than last year, an additional 800,000 workers are considered unemployed and actively seeking work.
Source: U.S. BLS, CES.

Patent Activity
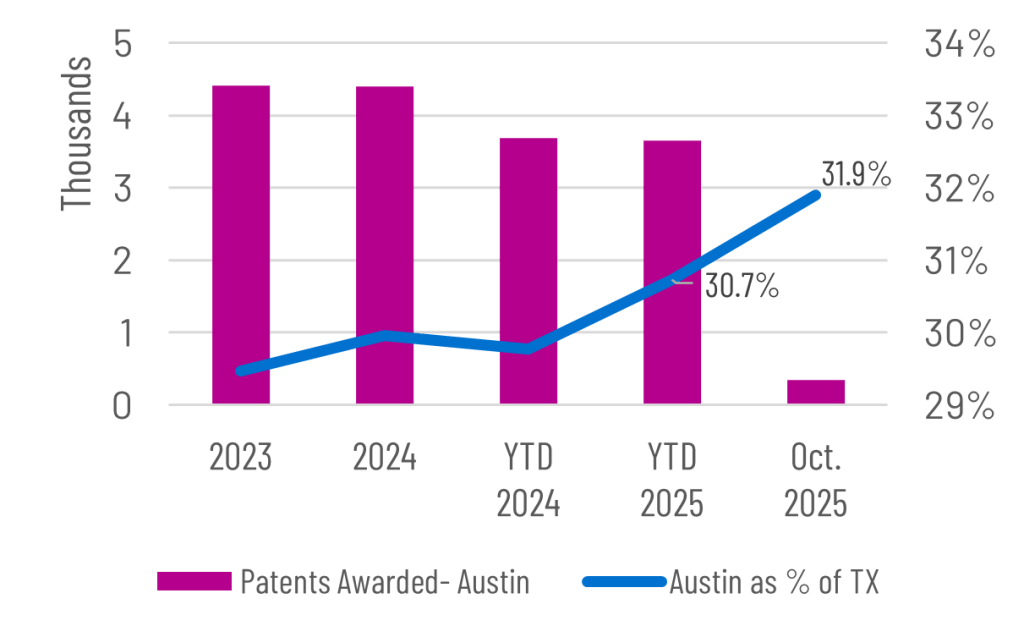
Austin inventors are averaging an impressive 4,500 patents awarded each year during the 2020’s, which is higher than the 3,750 averaged during the 2010’s. Patent activity in Oct. 2025 totaled 340, which is down from the same month last year when 436 patents were awarded. Patent activity YTD nearly matches the level in 2024, down just 40 patents at 3,646.
Austin continues to represent approximately 30% of patent activity in TX. This is a truly remarkable data point since the Austin MSA represents about 8% of the entire State population. Patent activity statewide is down 1.7% from 12,383 in 2024 YTD compared to 11,863 YTD 2025.
Source:U.S. Patent & Trademark Office.
AUS Airport Passenger Activity
Annual passenger counts through the Austin airport hit a record 22.1 million in 2023 and fell 1.5% in 2024. Through Oct. 2025, YTD totals at 17.95M are slightly down from the same time last year at 18.17M. Oct. 2025 was the busiest month in the airport’s history with 2.086 million passengers, surpassing the previous record of 2.068M passengers in May 2024.
Total cargo (including Belly freight, cargo and mail) totaled 301.9 million pounds in 2024, up 6.7% from 283.1 million pounds in 2023. The annual record for total cargo occurred in 2022 with 310.1 million pounds transported. For Oct. 2025, YTD cargo totaled 232.9 million pounds, which was an 8.3% decrease from the same time last year.
Source: City of Austin, Dept. of Aviation

Sales Tax Receipts
Sales tax allocation payments to the City of Austin grew 3.3% in 2023 and 2.4% in 2024. So far year to date through November 2025, receipts are down by just 0.2% compared to the same time last year. Payments to Austin were $31.2M in November 2025, up 4.1% from the same month last year.
In Round Rock, receipts were up 1.4% in 2023 and down 1.4% in 2024, San Marcos received 4.2% more funds from sales tax payments in 2023 and 2.1% less in 2024. For Nov. YTD, Round Rock’s sales are up 10.5% from 2024 YTD and San Marcos was up 0.3%. Statewide, Nov. 2025 YTD sales tax collections are up 4.3% compared to YTD 2024.
Source: Texas Comptroller

Home Sales
Home sales in the Austin region peaked at 41,094 in 2021. For the last two years, total sales were about 30,500. In October, YTD sales are down by about 425 or 1.6% compared to the same time last year. Statewide, YTD sales in Sep. were up 1.5% compared to 2024, while U.S. sales were up 0.1%.
The average sales price in the Austin region was $590,348 in Oct. 2025, up from $556,595 one year ago, while YTD the avg, sales price at $572.5K is up about $3.7K from 2024. In Oct. 2025, months on inventory in Austin was 5.3 months, down from a peak of 5.9 this summer. Months of inventory is almost 1 month higher than last year.
Source: TX A&M Real Estate Research Center

Consumer Price Index
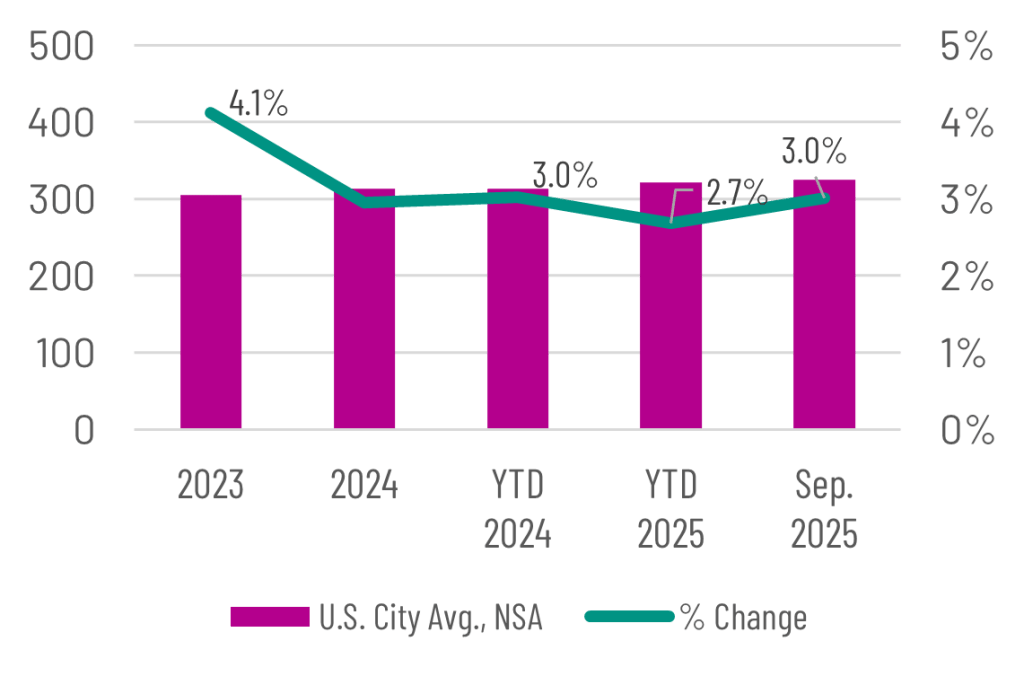
After reaching a 40-year high of 8.0% in the annual percent change in 2022, the U.S. Consumer Price Index fell to 4.1% in 2023 and 2.9% in 2024. Year over Year change in Sep. 2025 was 3.0%, slightly higher than the 2025 YTD increase of 2.7%.
While a CPI is not produced for the Austin metro, the Dallas metro index was up 1.9% in September over the same time last year, while the Houston metro index was up only 1.1% in August 2025. The CPI index for these two areas are only produced every other month. Some of the biggest contributors nationwide to increasing inflation in the Index were Natural Gas, up 11.7%; Electricity, up 5.1%; Medical Services, up 3.9%; Shelter, up 3.6%; and Food, up 3.0%.
Source:U.S. BLS, CPI
Upcoming Releases
December is usually a busy month for the release of key socio-economic stats. Two annual data releases usually drop in early December including the Bureau of Economic Analysis’ GDP by Metro and the Census Bureau’s 5-year American Community Survey results. Both releases are delayed by about two months: Here’s a summary of key upcoming dates:
- Metro Jobs & Unemployment release for September 2025: December 17, 2025,
- U.S. Census Bureau’s 5-year American Community Survey data: January 29, 2026,
- U.S. BEA’s 2024 Gross Domestic Product by County & Metro areas: February 5, 2026.
More Info & downloads
- Labor force, employment & unemployment
- Employees on nonfarm payrolls
- Hours & earnings
- Consumer price index
- Metro business cycle index
- Sales tax & retail sales
- Housing permits
- Home sales, listings & prices
- Air service
- Patent activity
- Commercial real estate
For questions about this data, please contact Chris Ramser, Vice President, Research (512.322.5662) or Joseph Morones, Director, Research.