
The Austin economy
According to the Dallas Federal Reserve Bank’s May report, jobs in the Austin metro have grown by 6,400 for an annualized growth rate of 1.3% during the first four months of 2026. The Dallas Fed noted that in recent months, statewide growth slowed from “two primary headwinds: immigration constraining labor supply, and higher productivity suppressing labor demand in some sectors.” The May report projected statewide job growth for 2026 to be closer to 1.2%. Opportunity Austin continues to track economic indicators throughout the region. Here are some key takeaways from our June report.
- Austin’s Y0Y job growth totaled 8,900 in April 2026, ranking as the eighth fastest growing of the Top 50 largest metros at 0.6%, exceeding Texas’ growth rate of 0.4%.
- Austin’s unemployment rate of 3.4% in April 2026 was the twelfth lowest among the Top 50 largest metros.
- Home sales for the first four months of 2026 totaled 9,600, up 600 sales or 6.6% from the same period last year. The average price for April 2026 was $586.5K, up from $583.3K one year ago.
Non-Farm Payroll Job Growth
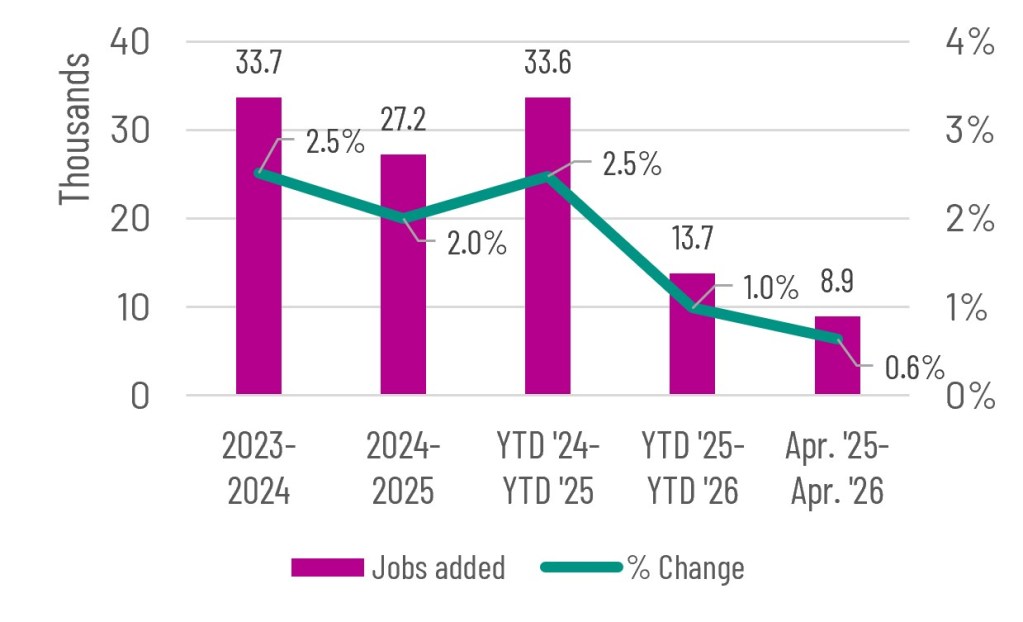
Job growth in Austin boosted in Apr. 2026 with an additional 4,000 jobs from Mar. 2026 in the non seasonally adjusted series. Apr. 2026 saw 8,900 jobs added to the region since the previous year, Apr. 2025.
Austin’s job growth of 0.6% from Apr. 2025 to Apr. 2026 exceeded the overall rate in TX at 0.4% and the US which was only 0.2%. Austin was ranked as the 8th best performing of the Top 50 metros in April 2026 for job growth. The Top 3 metros with the fastest job growth were Las Vegas, 2.0%, Salt Lake, 1.3 and San Jose, 1.3%. With growth of 0.5%, Fort Worth was the only other metro in Texas within the Top 10.
Source:U.S. BLS, CES.
Top Job Gains/Losses by Industry, Apr. 2026
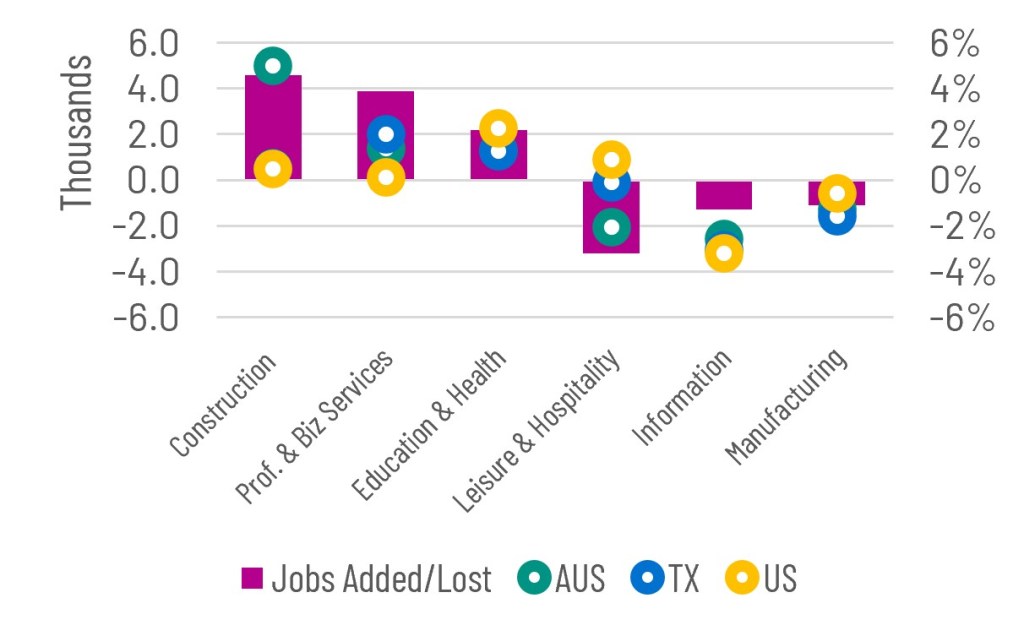
The best performing industries in Austin over the last year were Construction, Natural Resources, & Mining (4,600, 5.0%), Professional & Business Services (3,900 additional jobs, 1.4%), and Education & Health Services (2,200, 1.3%). Austin’s growth rate for Construction and Financial Activities jobs outperformed both TX and the US.
The worst performing industries within the Austin region were Leisure & Hospitality (-3,200, -2.1%), Information (-1,300, -2.6%), and Manufacturing, (-1,100, -1.3%). Of these three, Leisure & Hospitality was the only sector in Austin that performed worse this past year compared to TX and the US.
Source:U.S. BLS, CES.
Unemployment
After a steep 5.2% increase in the number of unemployed individuals in 2024, the number increased at a slower rate, 2.4% in 2025. The number of unemployed is 7.3% higher than one year ago, with increases in Texas and the US at 6.5% and 2.8%, respectively.
In April 2026, the number unemployed totaled 52,278 in Austin, which is 3,559 more than one year ago. In TX, the state experienced 38,787 more unemployed over the past year, while the total across the US was 186,000 higher.
Source: U.S. BLS, LAUS.

Unemployment Rate Comparison
The unemployment rate for the Austin region was 3.4% in April 2026, which is 0.3 higher from one year ago. Austin’s rate continues to perform better than both TX and the U.S. which each were at 4.0%. Other TX metros including Fort Worth, 3.7%, Dallas and San Antonio, both 3.8%, and Houston, 4.3% were all higher than Austin’s rate. In April 2026, Austin had the twelfth lowest unemployment rate of the Top 50 US metros.
Since recovering from a peak of 11.5% during COVID, Austin’s rate averaged 3.5% in 2023, 2024, and 2025. TX’s rate rose to 12.3% during COVID and declined to 4.0% in 2023 and has since averaged 4.2% in 2025. The US rate reached 14.4% in COVID and declined to 3.6% in 2023 but has since risen to 4.3% in 2025.
Source: U.S. BLS, LAUS.

Workforce Hours & Earnings
The average number of hours worked for payroll jobs in the Austin region in Apr. 2026 was 34.7, down from 35.8 this time last year. For 2026 YTD, hours worked is down 2.2% from 2025 YTD. Texas employees worked the same number of hours this year at 36.1, compared to last; while the US average was 34.3.
Average hourly earnings rose in Austin were $36.11 in 2025, up 3.9% compared to increases of 4.6% in Texas and 4.0% in US. For the first 4 months of 2026, average earnings in Austin were up 6.7% from $35.75 to $38.14. Increases both in the TX and the US were less profound at 2.2% and 3.6%, respectively.
Source:U.S. BLS, CES.

Metro Business Cycle Index
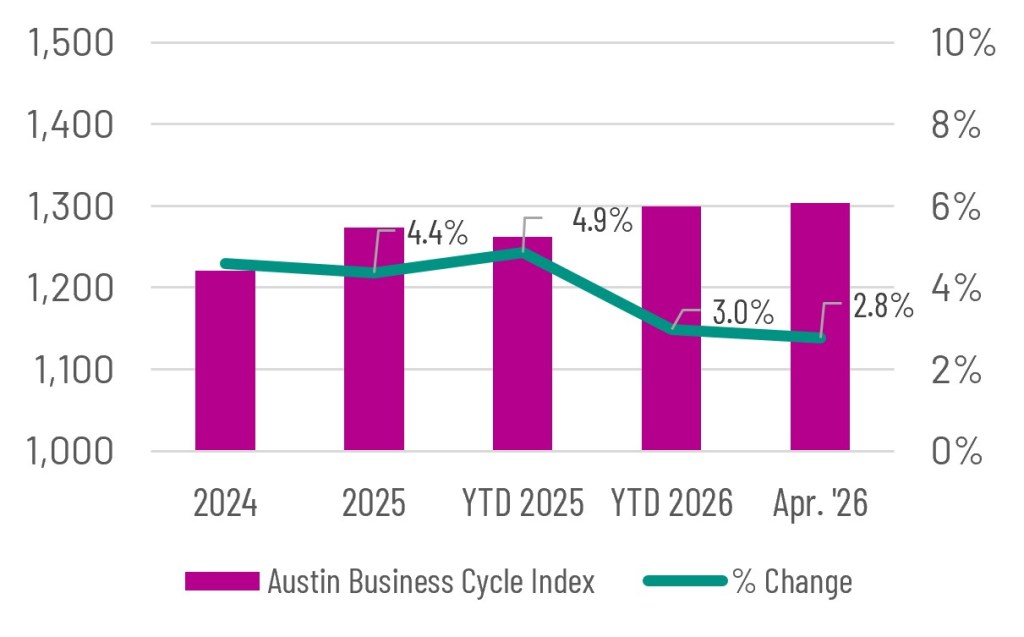
The Austin metro’s business cycle index continues to show growth in both the YTD and YoY comparison through April. After growth of 4.4% in 2025, the rate slowed to 3.0% for YTD 2026 compared to YTD 2025 growth of 4.9%.
Statewide, the business cycle index growth grew by 2.1% from YTD 2025 to YTD 2026, compared to growth of 3.0% from YTD 2024 to YTD 2025. Across Texas, YTD growth in the other major metros were 1.0% in Houston and San Antonio, while Dallas and Ft. Worth were 2.8% and 2.7%, respectively. Produced by the Federal Reserve of Dallas, the business cycle index reflects broad economic conditions including unemployment, inflation-adjusted wage and retail sales growth.
Source:Dallas Federal Reserve.
Consumer Price Index
After reaching a 40-year high of 8.0% in the annual percent change in 2022, the U.S. Consumer Price Index growth fell to 2.9% in 2024 and 2.6% in 2025. In April 2026, CPI was up 3.8% from last year. The biggest contributors to the increase were Energy, up 23.5% from last year with Fuel oil up 58.9% and Gasoline up 40.5%. Shelter and Medical services were each up 3.4% and 3.6% from last year.
While a CPI is not produced for the Austin metro, the Houston and Dallas metro indices were both up by 1.3% in 2025, which is improved from inflation rates of 2.5% and 3.9% in 2024, respectively.
Source:U.S. BLS, CPI.

Sales Tax Receipts
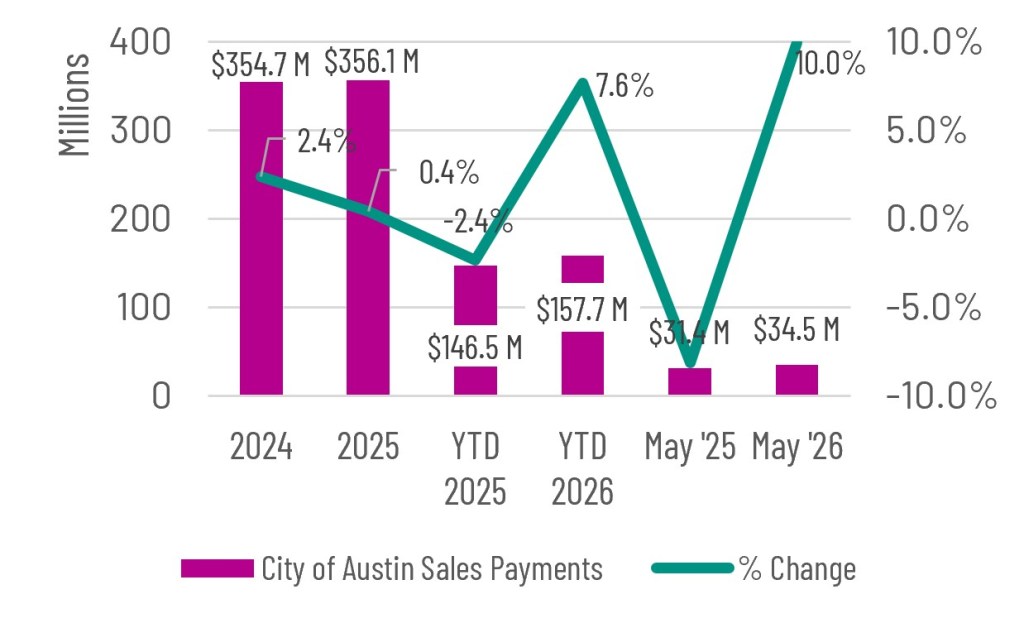
Sales tax allocation payments to the City of Austin totaled $356 million in 2025, a slight increase of 0.4% over 2024. Previously, payments were up 2.4% in 2024. For May 2026, the City of Austin received $34.5 million, up 4.3% from March 2025. YTD 2026 receipts are up 7.6% compared to -2.4% in YTD 2025.
In Round Rock, receipts totaled $129M and were up 10.5% in 2025 following a drop of -1.4% in 2024 and growth of 1.4% in 2023. San Marcos received 0.5% more in sales tax receipts in 2025 to $39M, which follows a decline of -2.1% in 2024 and growth of 4.2% in 2023. For YTD 2026 receipts were unchanged in Round Rock and up 3.8% in San Marcos over YTD 2025.
Source: Texas Comptroller.
AUS Airport Passenger Activity
Annual passenger counts through the Austin airport hit 21.6 million passengers in 2025, a drop of 0.4% from 2024. Through Mar. 2026, YTD totals are 4.89 million, up from the same time last year at 4.62million. March 2026 was the busiest March of all time with 1.97 million passengers, surpassing the previous record set in 2023 of 1.94 million.
Total cargo (including Belly freight, cargo and mail) totaled 276.4 million pounds in 2025, down 8.5% from 301.9 million pounds in 2024. The annual record for total cargo occurred in 2022 with 310.1 million pounds transported. March 2026 YTD cargo totaled 66.63 million pounds, which was a 1.9% increase from the same period last year.
Source: City of Austin.

Patent Activity
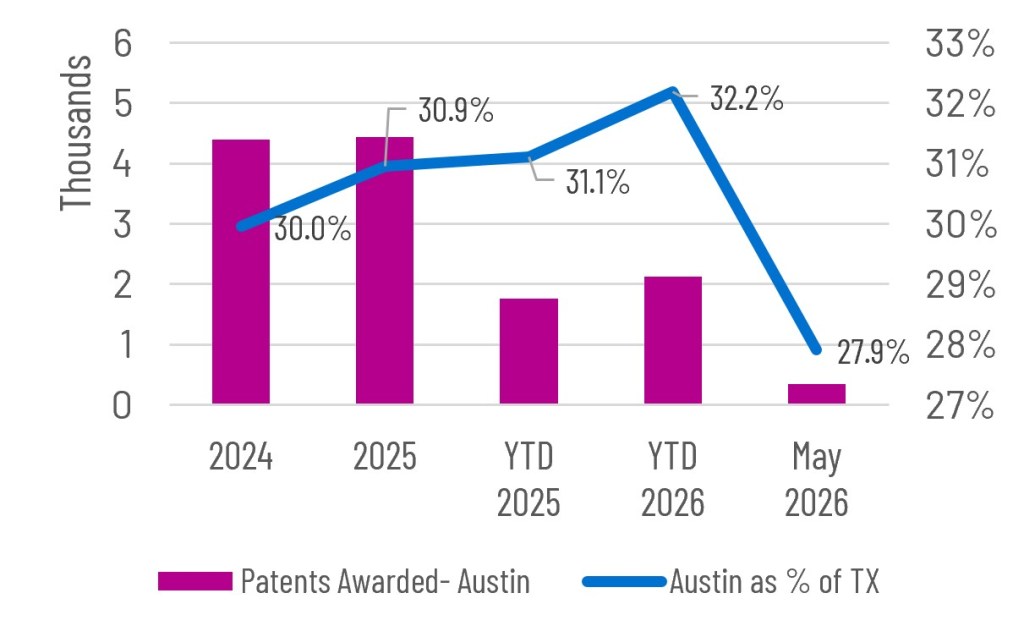
Austin inventors are averaging 4,520 patents applied each year during the 2020’s, which is higher than the 3,762 averaged during the 2010’s. Patent activity totaled 4,442 in 2025, up 1.1% from 2024. Texas saw a 2.2% drop in patents in 2025, while the US was up 0.3%. In Austin, 2026 YTD permits totaled 2,124 through May, up by 20.4% from YTD 2025.
Austin represents approximately 32.2% of patent activity in TX this year. This is a truly remarkable data point since the Austin MSA only represents around 8% of the entire population of the State. Austin’s share of TX patents increased to 30.9% in 2025, up from 30.0% in 2024 and 29.5% in 2023.
Source:U.S. Patent & Trademark Office.
Venture Capital Investment
Venture Capital funding in Austin reached record levels with a total $7.24 billion raised in 2025, up 80.4% from $4.01 billion in 2024. Previously, Austin’s record VC funding year was 2021 when $6.88 billion was raised.
With it’s best year ever in 2025, Austin moved up a spot to the fifth highest amount of VC investment of any metro in the U.S. Austin’s share of VC funding nationwide increased to 2.3% in 2025, up from 1.9% in 2024.
Strong VC activity continued in 2026 with first quarter VC raised of $4.85, the single largest quarter recorded in Austin history. The largest deals were Saronic, $1.75B; Apptronik, $935M; CesiumAstro, $470M; and inKind, $450M.
Source: Pitchbook.

Housing Permit Activity
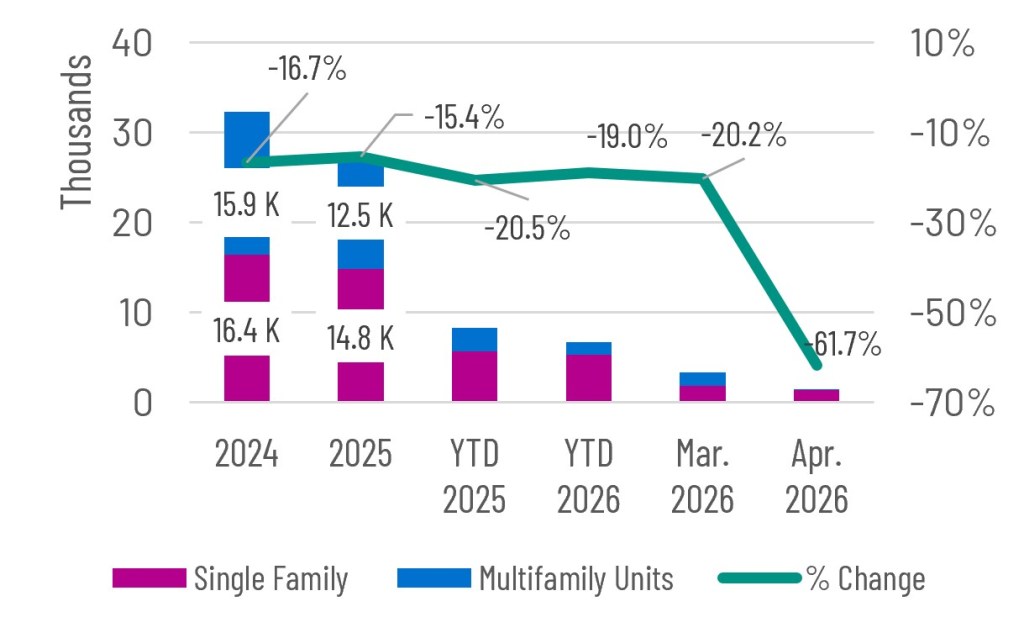
Building permits issued in the Austin region came down from historic highs of between 42,000 to 51,000 units in 2021 and 2022. Last year a total of 27,000 units were issued, down 15.4% from 2024. In Austin, 2026 YTD permits through April were 6,730, down from 8,307 last year, a -19.0% decrease. Nationally, total permits were down -1.9% this year.
Last year in the Austin region, the share of single-family units exceeded multifamily, a continuation from 2024. Previously from 2021 to 2023, multifamily permits exceeded single family. In April 2026, 1,386 single family permits were issued compared to only 125 multifamily units.
Source: U.S. Census Bureau Building Permits Survey.
Home Sales
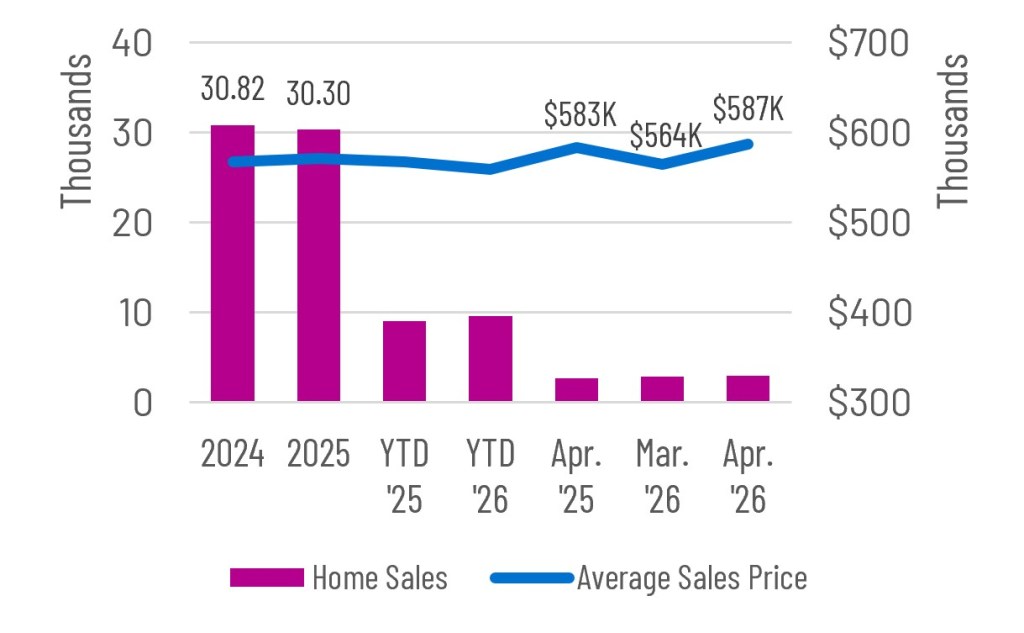
Home sales in the Austin region peaked at 41,094 in 2021. In the past 3 years, total sales have been lower, averaging 30,500. However, for YTD 2026, sales are up by about 600 or 6.6% compared to the same time last year. Statewide, YTD sales are up 2.5% compared to 2025, while U.S. sales are up 0.8%.
The average sales price in the Austin region average $570,480 in 2025, a slight increase of about $3,000 from 2024. In April 2026, the average sales price was $586,550, which was up from $583,362 one year ago. In Apr. 2026, months on inventory in Austin was 5.2 months, which was unchanged from one year ago.
Source: TX A&M Real Estate Research Center.
Commercial Real Estate Activity
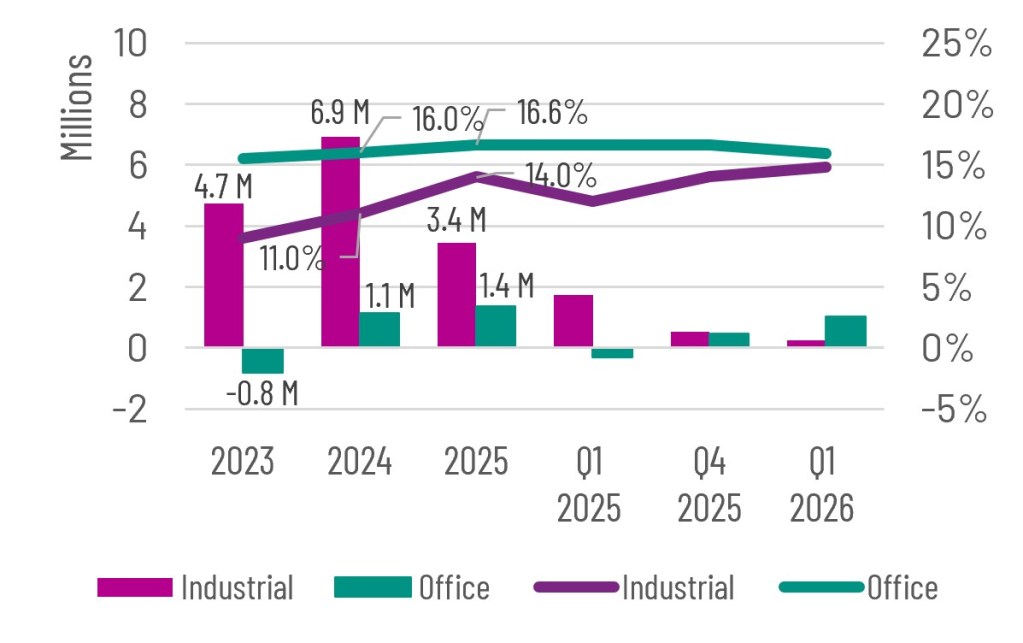
After having office vacancy rates of around 7 to 8% just before COVID in the Austin region, continued new construction delivery and softened leasing activity has brought the office vacancy rate up to 16.6% in 2025 compared to 16.0% in 2024. The current office market totals 138M SF, having added 18.4M SF of new inventory since 2020 Q2. Quoted lease rates in 2026 Q1 ticked down to $43.70 from $44.15 in 2025 Q4.
Likewise, the Austin industrial market has grown to 176M SF, adding 63M SF since 2020 Q2 or 55% growth over 5 years. The vacancy rate reached 14.0% in 2025, up from 11.0% in 2024. Quoted lease rates were $14.78 in 2026 Q1.
Source: CoStar.
Upcoming Releases
The Texas Workforce Commission will publish its long-term occupational projections data in July. This dataset is released every two years providing a snapshot of what the labor market’s occupations will look like over a 10-year period, 2024-2034, for each of the State’s 28 Workforce Development Areas. Other upcoming releases include:
- The Census Bureau will release detailed 2025 population estimates by age, sex, race, and Hispanic origin in June,
- The U.S. BLS Metropolitan Area Employment and Unemployment Statistics for May 2026 on July 1, 2026.
- 2026 Q2 Venture Capital data from Pitchbook and Commercial real estate data from CoStar will be released in July.
More Info & downloads
- Labor force, employment & unemployment
- Employees on nonfarm payrolls
- Hours & earnings
- Consumer price index
- Metro business cycle index
- Sales tax & retail sales
- Housing permits
- Home sales, listings & prices
- Air service
- Patent activity
- Commercial real estate
For questions about this data, please contact Chris Ramser, Vice President, Research (512.322.5662) or Joseph Morones, Director, Research.