


STEM Occupational employment & Salaries, August 18, 2026
Chris Ramser, Vice President, Research
Joseph Morones, Director, Research
Insights
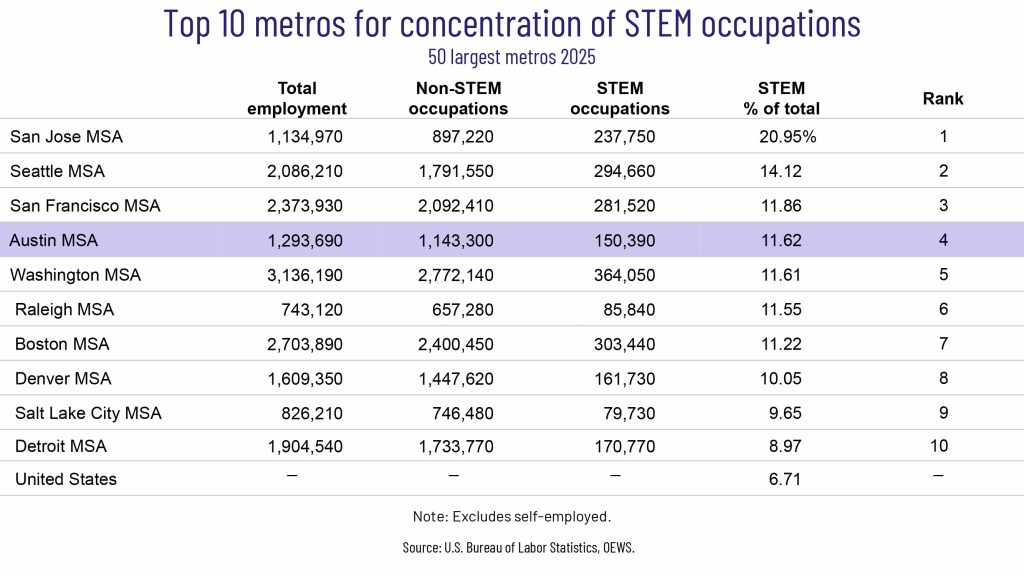
- STEM occupations account for over 11.62% of all jobs in the Austin MSA in 2025, making Austin the 4th most concentrated in STEM among large U.S. metros.
- Since 2020, STEM occupations in Austin have grown by 19.8%, adding nearly 25,000 jobs and bringing the total number of workers to 150,390.
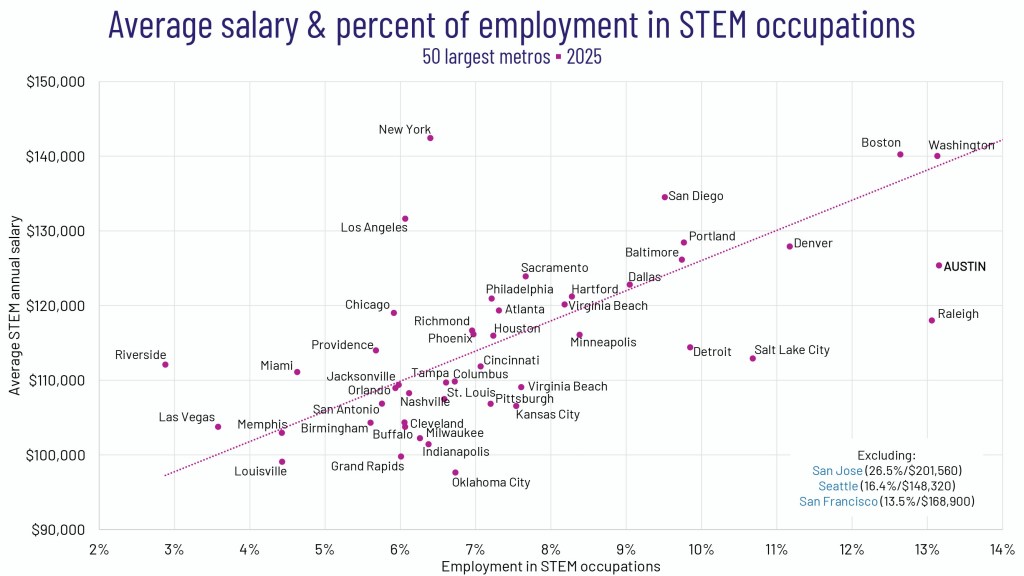
- Austin & Raleigh are the only two large US metros with more than 13% of jobs in STEM paying an average STEM wage of less than $130K.
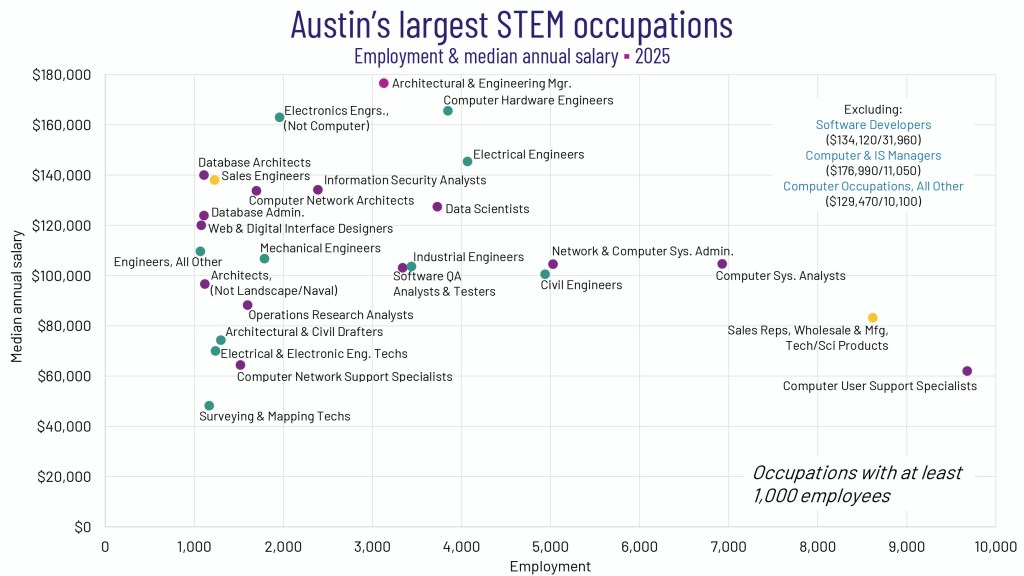
- Austin’s two largest STEM occupations are Software Developers (31,960 jobs) and Computer & Information Systems Managers (11,050 jobs).
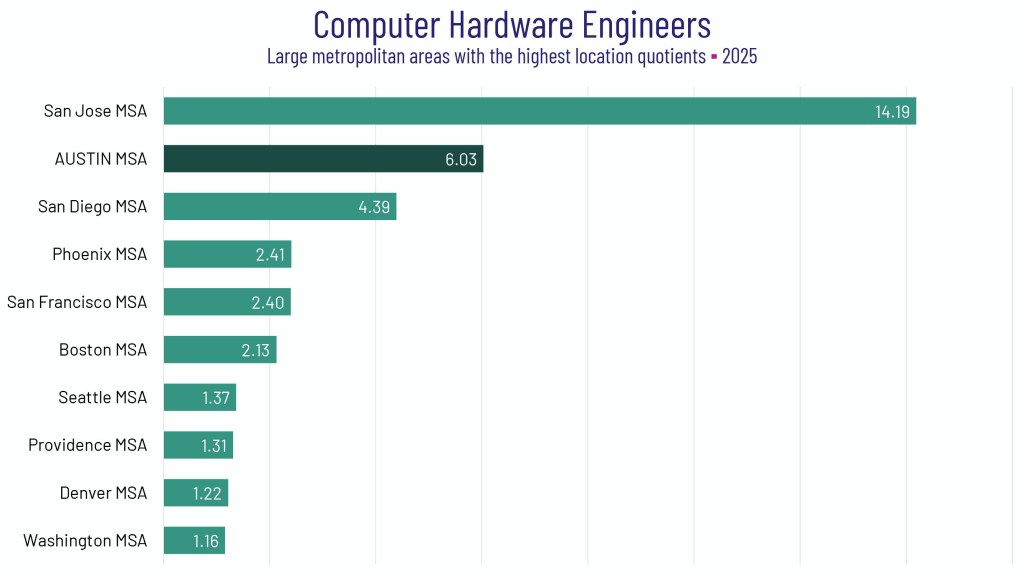
- Austin’s number of Computer Hardware Engineer workers has grown by 3,000 over the last year, and the region is now the second highest concentration of those positions of any Major Metro in the US behind San Jose.
New data released by the U.S. Bureau of Labor Statistics (BLS) last month provides estimates of 2025 employment and salaries by occupation. These estimates from the Occupational Employment & Wage Statistics (OEWS) program are available for the nation as a whole and for over 500 other areas.
Across all occupations, Austin’s average annual salary is $74,580, up by 4.5% from last year, and its median salary is $56,950, which is up 8.3%. The average hourly wage is $35.85 and the median is $27.38 in the Austin metro. Austin’s average salary is 6.9% above the national average and the median is 11.7% above the national median.
Part of the differences in average wages and salaries between different areas is due to variation in the mix of occupations prevalent in each area. Over 830 occupations are covered in the OEWS survey, with about 630 of those estimated for the Austin MSA. The OEWS survey is sent to hundreds of Austin-area employers every May and November and is vital as the foundational data needed to quantify pay and employment for occupations.
Associated with the survey are a pair of supplementary sets of OEWS data treating science, technology, engineering and math (STEM) occupations and occupations by the typical entry-level educational requirement. The following focuses on insights from the STEM tabulations.
STEM JOBS BY OCCUPATION GROUP
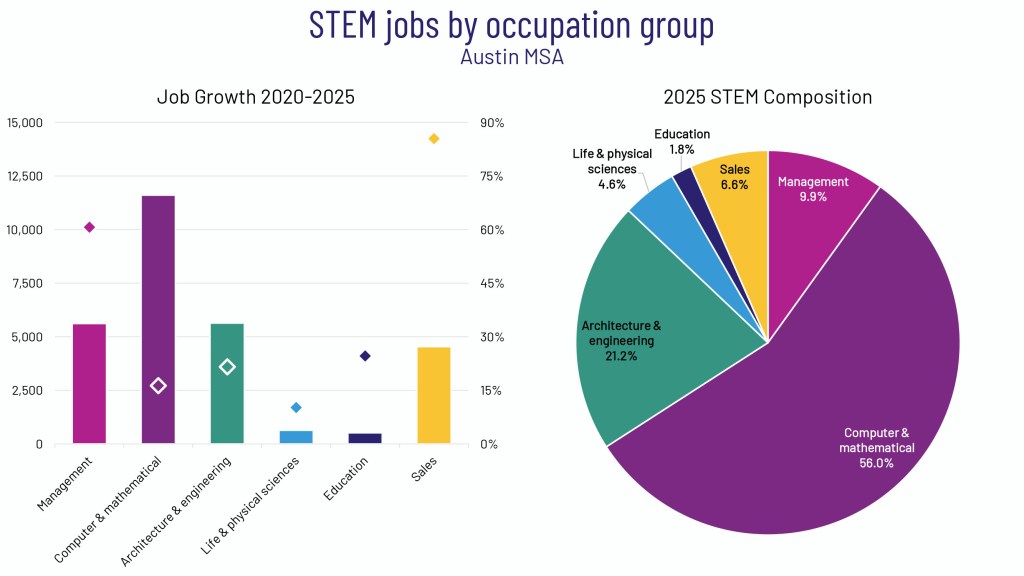
BLS classifies 105 occupations as STEM, including computer and mathematical, architecture and engineering, and life and physical science occupations, as well as managerial and postsecondary teaching occupations related to these functional areas, and sales occupations requiring scientific or technical knowledge at the postsecondary level.
In 2025, there were an estimated 150,390 STEM jobs[1] in the Austin metro, an increase of 19.8% or over 24,940 jobs since 2020. STEM jobs represent 11.62% of Austin’s total employment, while nationally, STEM accounts for 6.71% of total employment. Austin added jobs in each major occupational group, but faster growth rates in both Sales and Management indicate a maturing Austin technology scene. Nevertheless, Computer and Math still added the most jobs over the last 5 years (11,500) and represent 56% of all STEM jobs.
TOP 10 METROS FOR CONCENTRATION OF STEM OCCUPATIONS
Among the 50 largest metros, Austin ranks fourth for percentage of jobs in STEM occupations. San Jose tops the major metros ranking with 20.95% in STEM. Las Vegas and Riverside have the lowest employment shares, 3.45% and 2.80%, respectively.
The share of STEM employment in Texas has grown from 6.7% in 2020 to 7.1% in 2025. The range among the major Texas metros is wide. Dallas-Fort Worth’s percentage is 8.30% (ranking 14th), Houston’s is 6.75% (22nd), while San Antonio’s is 5.44% (ranking 43rd).
AVERAGE SALARY & PERCENT OF EMPLOYMENT IN STEM OCCUPATIONS
Across major metros, higher shares of STEM employment are associated with higher average salaries overall. The graph below shows a positive correlation between higher average salaries and greater concentration of STEM jobs. Metros that are plotted under the trendline and further to the right (such as Austin and Raleigh) have relative high concentrations of STEM jobs at a lower average wage. For Austin, the mean salary for STEM occupations was $125,360 and in Raleigh, it was $118,000. No other metros had over 13% of their jobs in STEM related fields and paid an average STEM wage of less than $130K.
STEM OCCUPATION SALARIES BY PERCENTILE
In Austin, STEM occupations earn a median annual salary of $113,630 compared to $50,140 for non-STEM occupations. Nationally, STEM’s median salary is $106,360 compared to $49,050 for non-STEM. The median STEM salary in Austin is 227% of the non-STEM salary—which is slightly more than the national premium that STEM jobs pay at 217%. STEM salaries are highest in San Jose, which has a median of $182,070, which is 264% of San Jose’s $69,090 non-STEM salary. That difference is the largest among the top 50 metros. Within the OEWS data set, the BLS calculates a set of wage percentiles for each occupation. Often the percentiles can be used to distinguish higher pay rates for more experienced or skilled workers in a given occupation.

HIGHEST & LOWEST PAYING STEM OCCUPATIONS
The three highest paid STEM occupations in Austin are Computer Information Systems (IS) Managers, Architectural & Engineering Managers, and Petroleum Engineers, while the three highest paid STEM occupations nationally are Computer IS Managers, Physicists, and Architectural & Engineering Managers. In Austin, Computer IS Managers have a median salary of $176,990 which is only 1% above the national median of $175,140, while Architectural & Engineering Managers have a median salary of $176,540 which is just 3% above the national median of $171,270. Compared to San Jose, where Computer & IS Managers and Architectural & Engineering Managers are much more concentrated, Austin’s median salaries are 39% less and 25% less, respectively, than pay in San Jose.
Each of the lowest paid STEM occupations are technician roles often requiring medium term preparation including vocational schools, on-the-job training or an associate’s degree. Austin’s most common of these roles include Surveying and Mapping Technicians ($48,160) and Industrial Engineering Technologists & Technicians ($52,000). Both occupations are relatively common in Austin and pay median wages below the national median by 11% and 21%, respectively.

The graph below shows the median annual salary of Austin largest STEM occupations including those that have at least 1,000 employees. Computer User Support Specialists are among the more numerous, but their median pay at about $61,990 is one of the lower paid Computer & Math occupations. The occupation’s median pay nationally at $61,860 is roughly the same as in Austin.
EMPLOYMENT IN AUSTIN’S LARGEST STEM OCCUPATIONS
Austin’s largest STEM occupation by employment is Software Developers, which is estimated at 31,960 jobs. As the graph below indicates, this occupation has a location quotient (LQ) in Austin of 2.28.

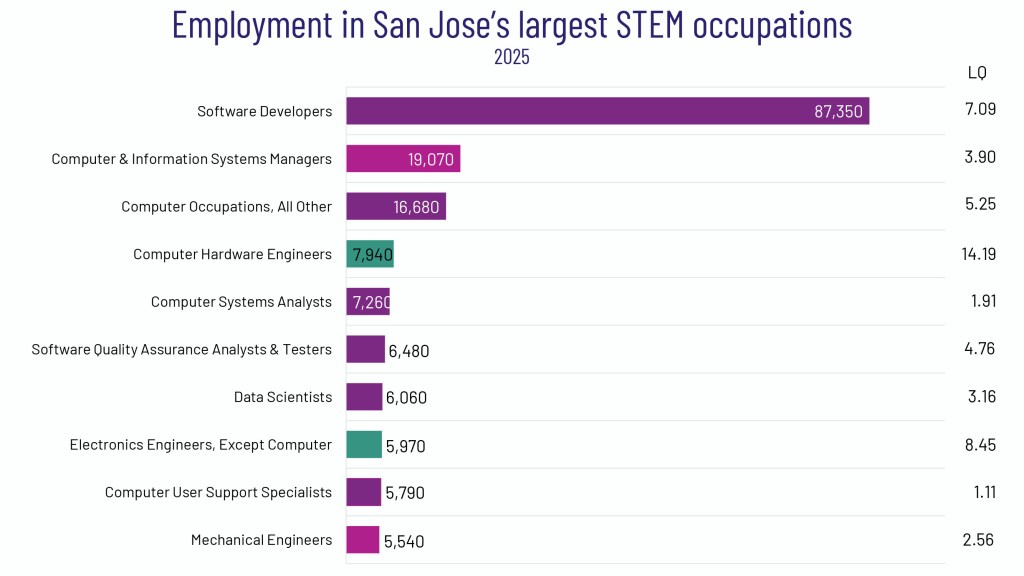
Location quotients are a useful byproduct of the survey’s employment estimates. The location quotient (LQ) represents the ratio of an occupation’s share of employment in a given area to that occupation’s share of employment in the U.S. as a whole. In this case, Software Developers make up 2.47% of employment in Austin compared nationally where 1.08% of jobs are Software Developers. Austin’s 2.47% rate is 2.28 times the national rate of 1.08%, therefore Austin’s LQ for the occupation is 2.28 The occupation is also San Jose’s largest STEM occupation (87,350 jobs), and San Jose’s LQ for software developers is greater at 7.09. Below are the STEM occupations in San Jose employing the most workers.
STEM OCCUPATIONS WITH THE HIGHEST LOCATION QUOTIENTS
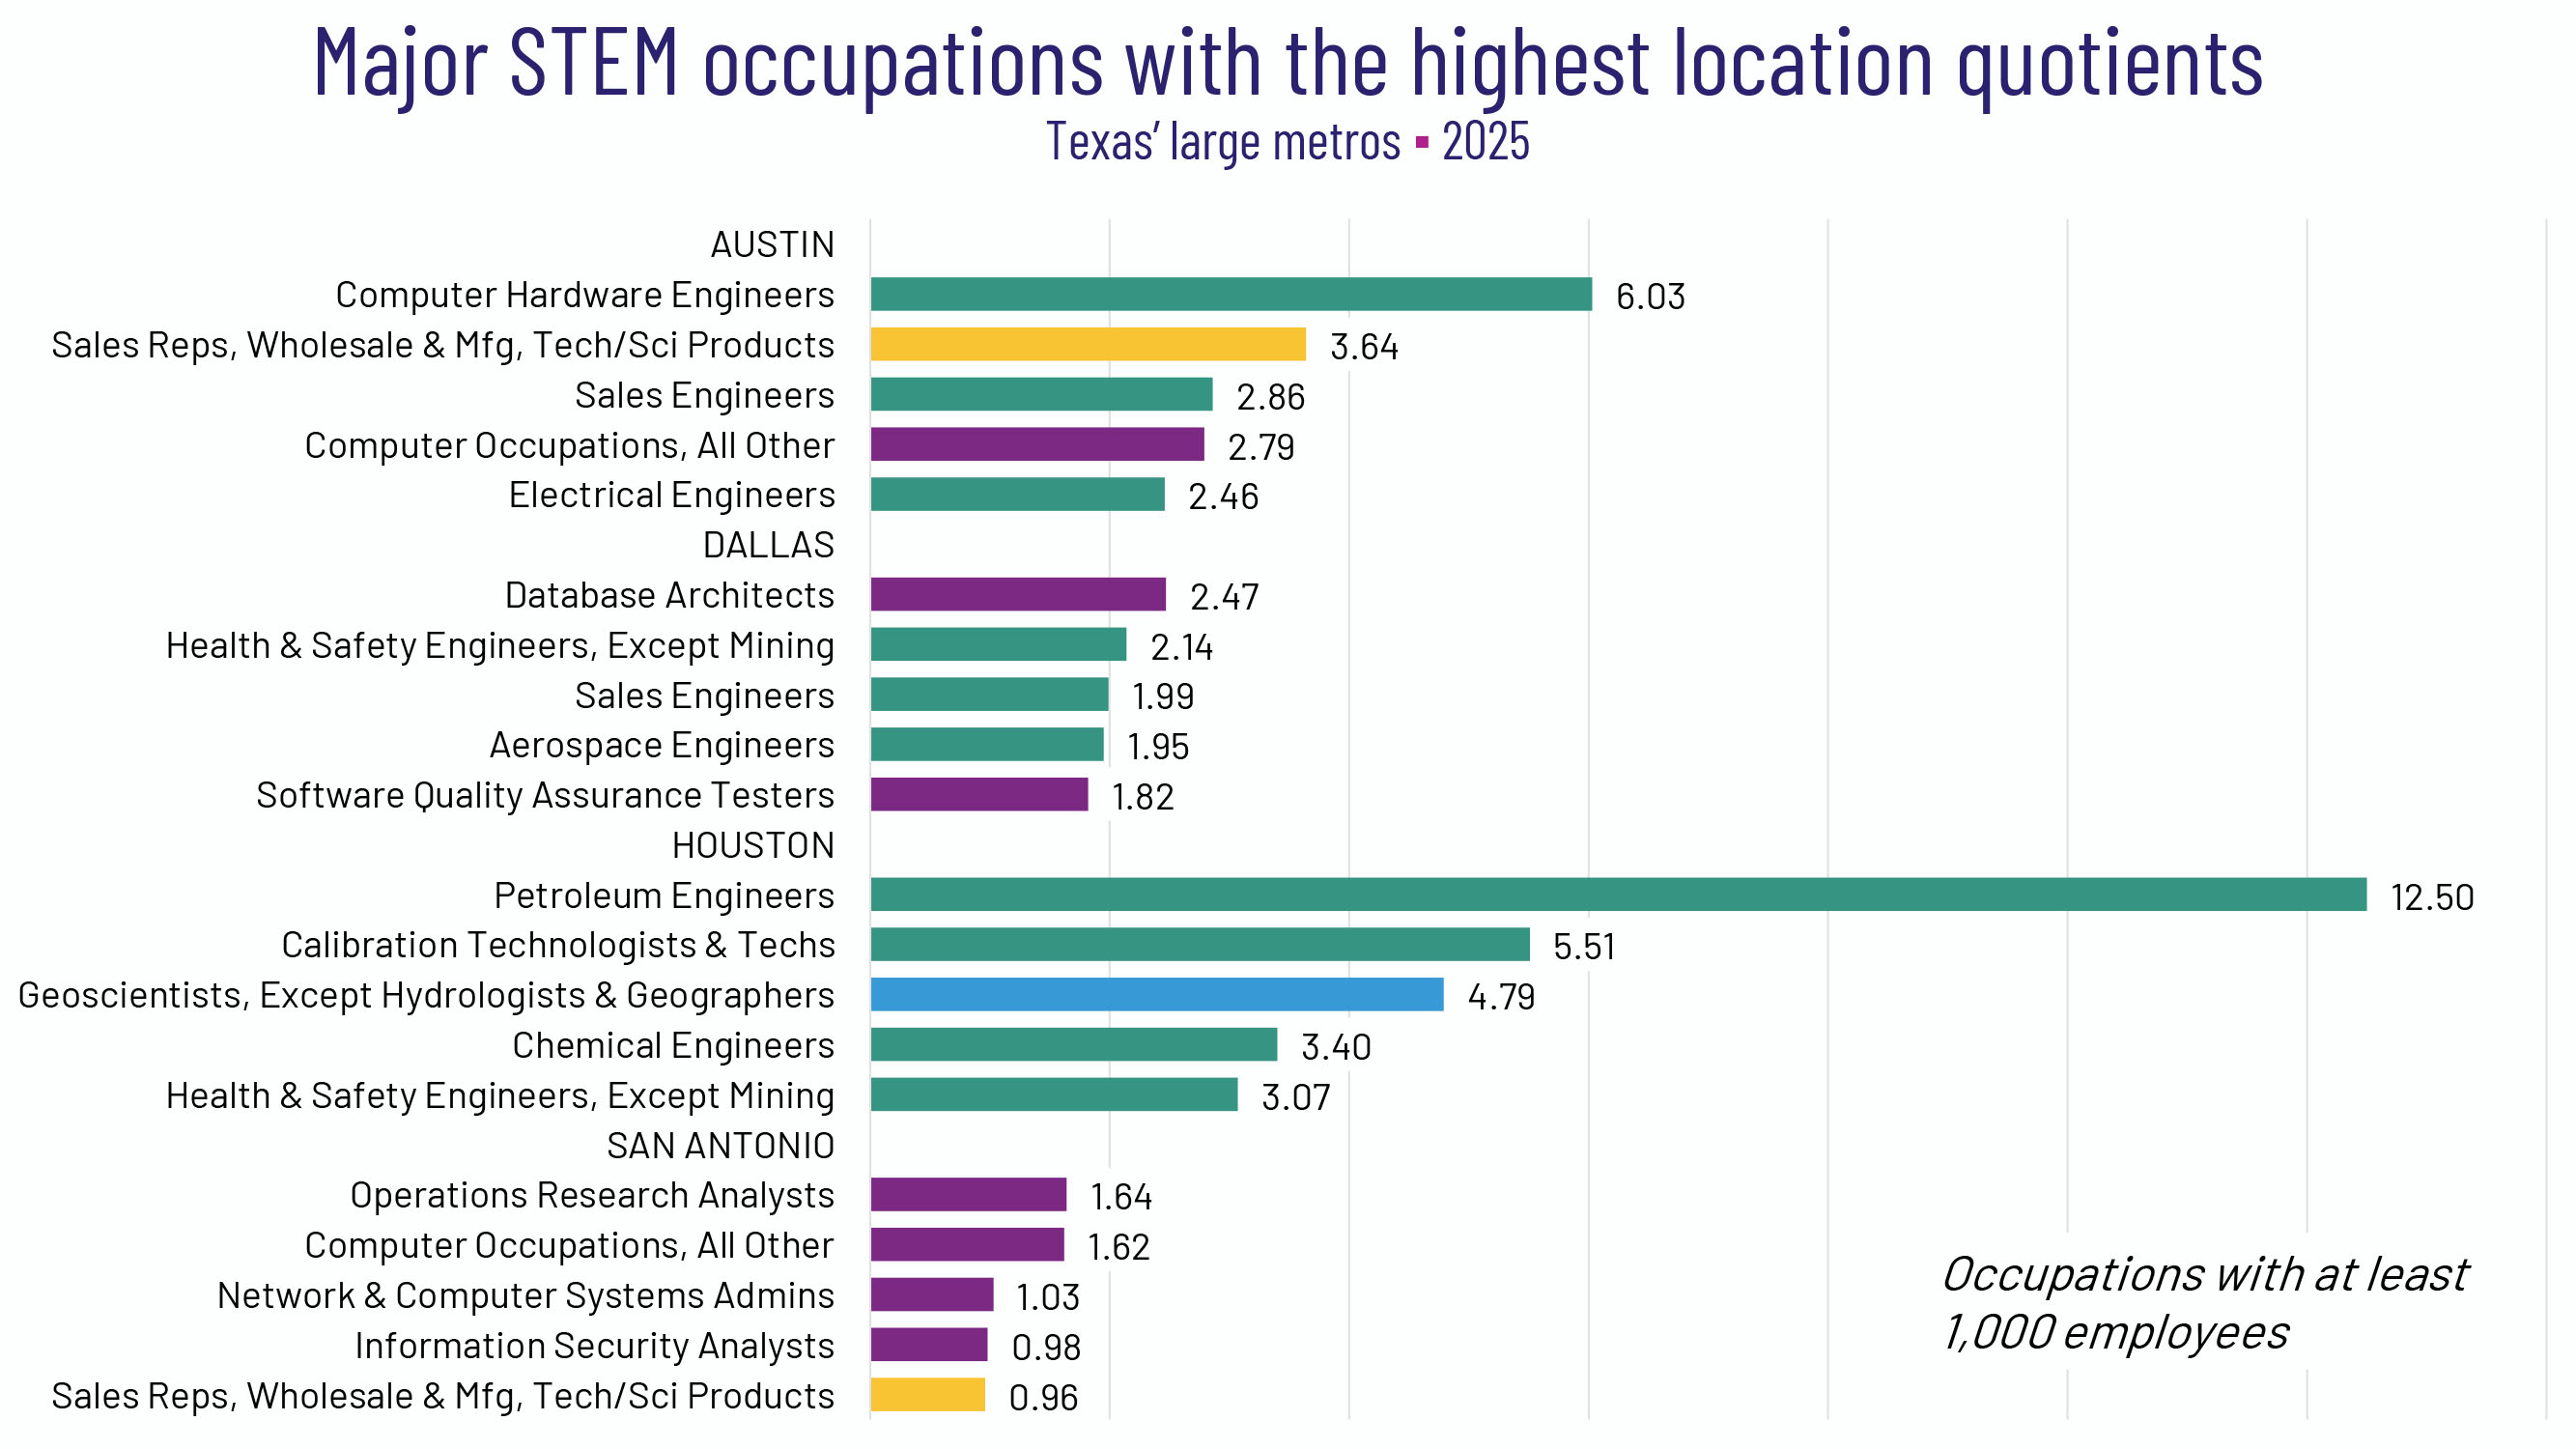
Among Austin’s top 10 STEM occupations, the one with the highest LQ is Computer Hardware Engineers (6.03) followed by Sales Representatives, Wholesale & Manufacturing, Technical/Scientific Products (3.64). Just one year ago, the location quotient for Computer Hardware Engineers in Austin was just 1.17 with about 3,000 fewer workers in that position.[2] With several new relocation announcements by companies that are making computer & hardware components such as Compal, Pegatron, ZT Systems, and CelLink, growth in this occupation can be expected.

Five years ago (in 2020), Austin’s list of STEM Occupations with the highest LQs looked quite different and included Landscape Architects, 3.07; Geological & Hydrologic Technicians, 2.71; Conservation Scientists, 2.67; Surveying & Mapping Technicians, 2.45; and Information Security Analysts, 2.41. In 2025, none of those are among Austin’s Top 5 highest location quotients for STEM occupations.
TOP STEM LOCATION QUOTIENTS FOR TEXAS MAJOR METROS
The highest LQ among the largest Texas metros is found in Houston where there are 4,770 Petroleum Engineers. Nationwide, there are only a total of 18,060 Petroleum Engineers, so Houston’s 12.50 LQ is quite impressive. However, it does not come close to that of Midland, which, while their number of employed (940) is only one fifth that of Houston, it has a larger LQ of 66.36. Nationally the occupation accounts for 0.01% of all jobs, while in Houston the rate is 0.14% and in Midland it is 0.76%.
AUSTIN STEM LOCATION QUOTIENT RANKINGS
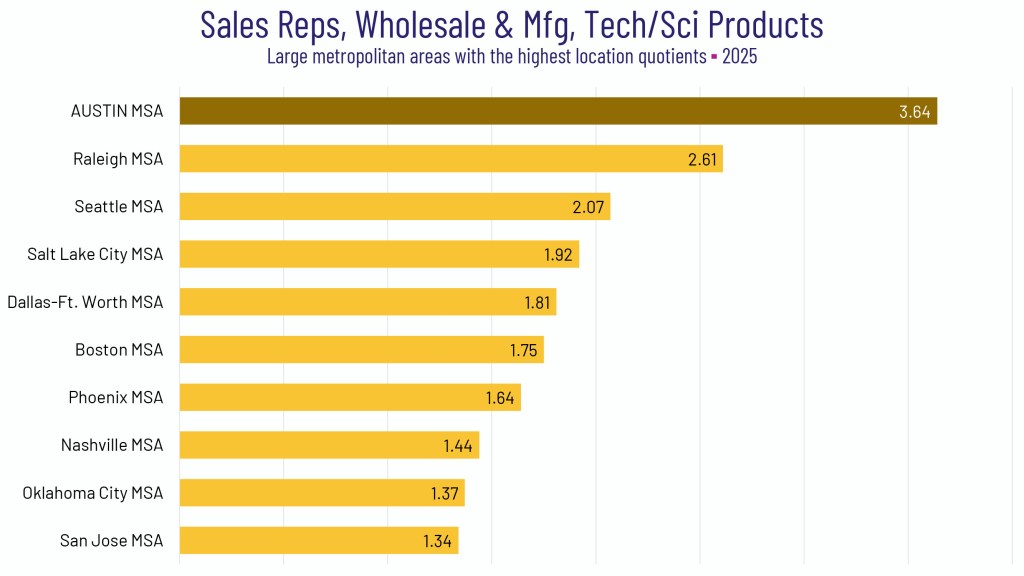
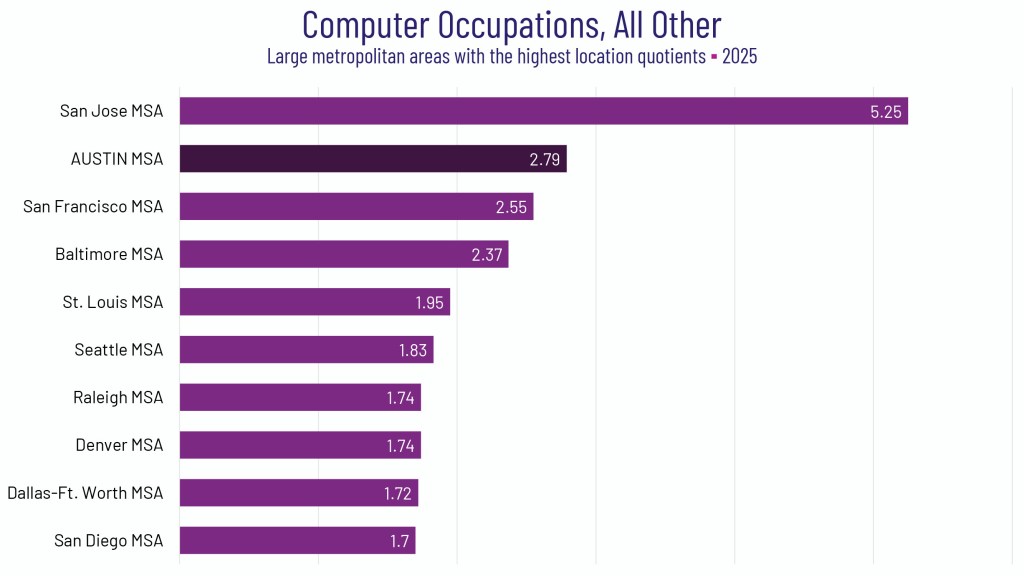
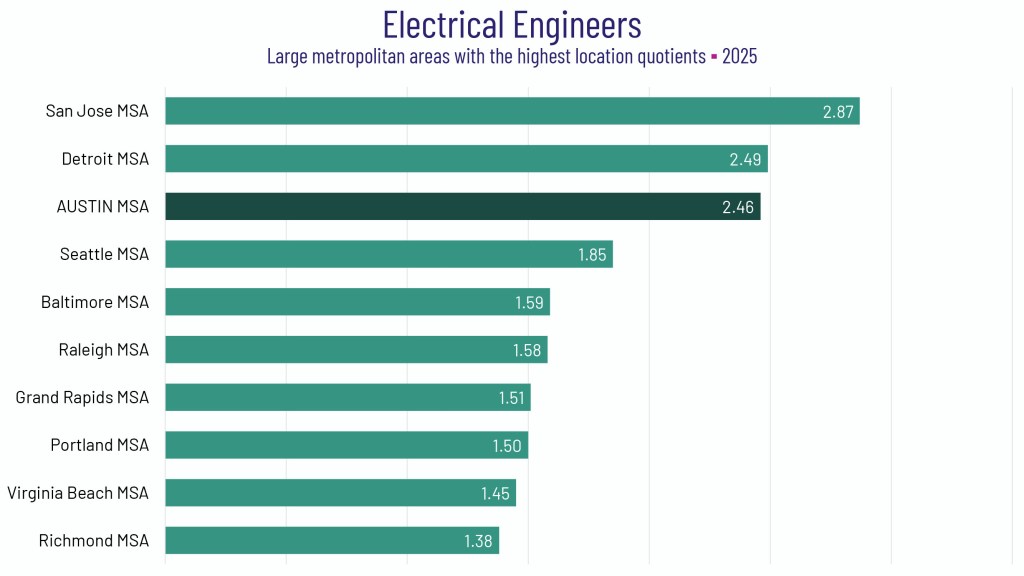
Four notable Austin STEM occupations stand out with top rankings for highest location quotients among the 50 largest U.S. metros, indicating that employers rely on our region for these types of roles to a greater degree than in other major metros. These include: Sales Reps, Wholesale & Manufacturing, Technical & Scientific Products (Ranked 1st), Computer Hardware Engineers (Ranked 2nd) Computer Occupations, All Other (Ranked 2nd)[3], and Electrical Engineers (Ranked 3rd). The final four slides show the Top 10 metros with the highest concentration of jobs for those particular occupations.
Download a complete set of Austin & US Cross Industry Occupational Employment & Wages estimates in Excel.
FOOTNOTES
[1] It should be noted, when relying on employment estimates for individual occupations like these, that estimates are subject to the survey’s sampling error. The BLS publishes relative standard error (RSE) statistics for each employment estimate. The RSE is defined as the ratio of the standard error to the survey estimate. For example, a RSE of 10% implies that the standard error is one-tenth as large as the survey estimate. Austin’s total STEM employment estimate (150,390) has a relative standard error (RSE) of 0.9. In some cases, survey data is of insufficient quality to meet publication standards and employment estimates (and/or salaries) are suppressed.
[2] Since the data are collected through a survey and are subject to relative standard error (RSE), it is impossible to determine exactly how much this occupation has grown. However, using a 95% confidence interval and the provided RSEs for both estimates, the number of Computer Hardware Engineers in Austin may have increased by as few as 2,500 or as many as 3,650 over the past year.
[3] While the BLS does not specifically define this role, examples include job titles such as Web Administrators, Information Security Engineers, IT Project Managers, and Digital Forensic Analysts.


