The Austin economy
Opportunity Austin is pleased to announce a reenvisioned monthly Economic Indicators report. The new report features 14 data points highlighting the economic vitality of the Austin Metro area. This report along with the associated data files utilized to compile the report will be sent to subscribers of the By the Numbers newsletter and posted on our website’s “News section” by the middle of each month. Here are some takeaways from this month:
- Similar to the U.S. & Texas, Austin’s YTD job growth slowed from 30K jobs added in 2024 to 16.5K added in 2025.
- For July 2025, the unemployment rate in the region was 3.5%, down from 3.8% in July 2024. Austin’s rate continues to perform better than that of TX at 4.2% and the U.S. at 4.6%.
- Growth in Austin’s Business Cycle Index slowed to 2.1% for the first 7 months of 2025, compared to 2024. YTD growth in the other major metros was between 1.8% in Houston to 3.5% in Dallas. Fort Worth was at 2.5% and San Antonio was at 2.2%.
- June 2025 was the second busiest month at AUS airport with 2.014 million passengers, exceeding June 2024 by 0.1%. YTD passenger activity was down slightly from 10.88 million last year to 10.33 million in 2025.
Non-Farm Payroll Job Growth
Revised job growth for the Austin region was 2.2% in 2024 adding 29,400 jobs. Like this time last year, the preliminary Bureau of Labor Statistics (BLS) monthly job releases are showing softer job growth for the region. Jobs added YTD 2025 exceed YTD 2024 by 16,500 jobs or 1.2%. Austin’s job growth of 0.7% from July 2024 to July 2025 trailed the overall rate in TX, 1.7%; and the US, 0.9%. Austin was the 31st best performing of the Top 50 metros. Despite, the unusually low ranking for Austin, only 5 metros saw growth over 2.0% and Austin was just 0.5% from 17th place.

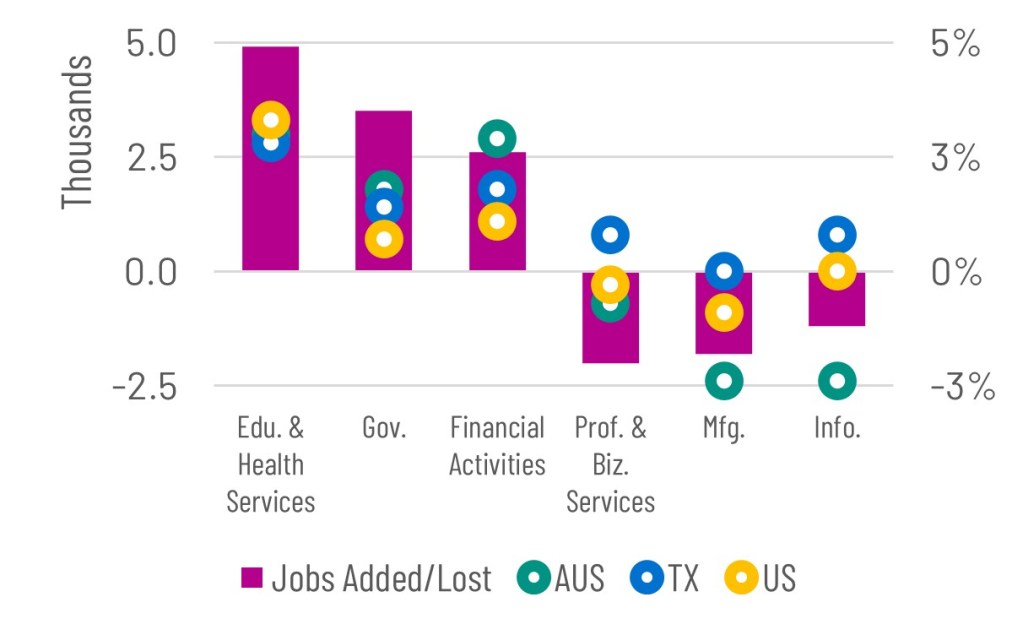
Top Job Gains/Losses by Industry, July 2025
The best performing industries in Austin over the last year were Education Health Services (up 4,900, 3.0%), Government (3,500, 1.8%), and Financial Activities (2,600, 2.9%). Austin’s growth rate for Financial Activities outperformed both the TX and the US and was nearly comparable to their rates for the Education & Health Services industry. The worst performing industries were Professional & Business Services (-2,000 , -0.7%), Manufacturing, (-1,800 , -2.4%), and Information (-1,200, -2.4%). Each of these industries performed better in TX & US overall. TX had positive growth for Information and Prof. Biz Services, but slightly negative growth in Mfg.
Source:U.S. BLS, CES.
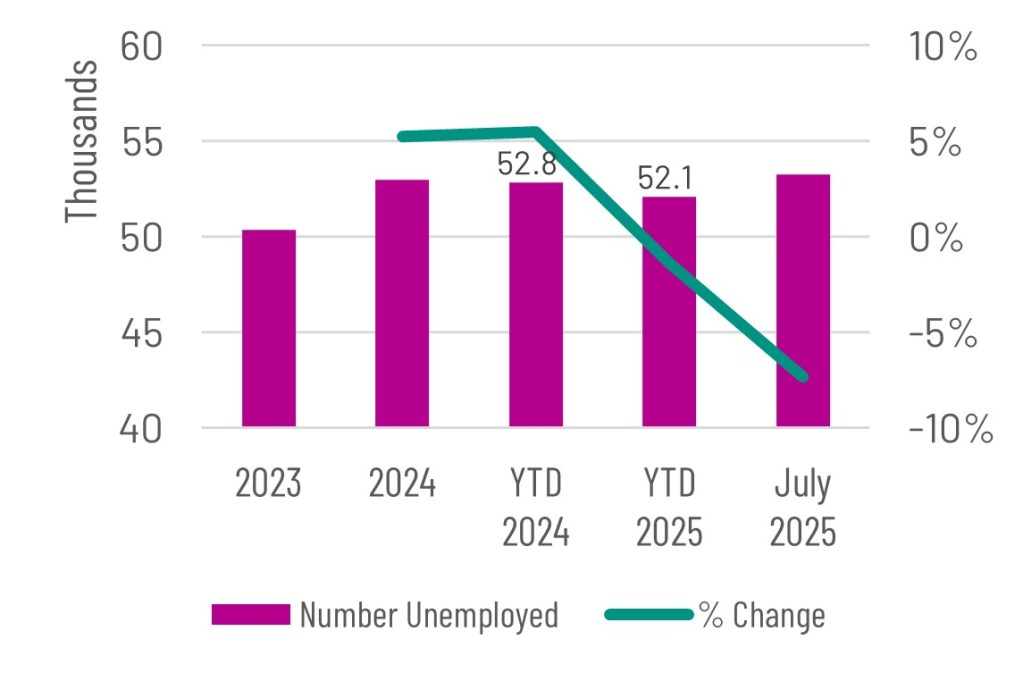
Unemployment
The recent low mark for the total number of unemployed in the Austin region was in 2022 with just 42,100 out of work jobseekers. Both 2023 and 2024 saw increases in the total number of unemployed. For YTD 2025 Austin has slightly less unemployed, 750, compared to YTD 2024.
In July 2025, the number unemployed totaled 53,250, which is 4,200 less people than July 2024 when the total unemployed was 57,450. TX has 40,200 less unemployed compared to this time last year, while the US actually had 162,000 more unemployed.
Source: U.S. BLS, LAUS.
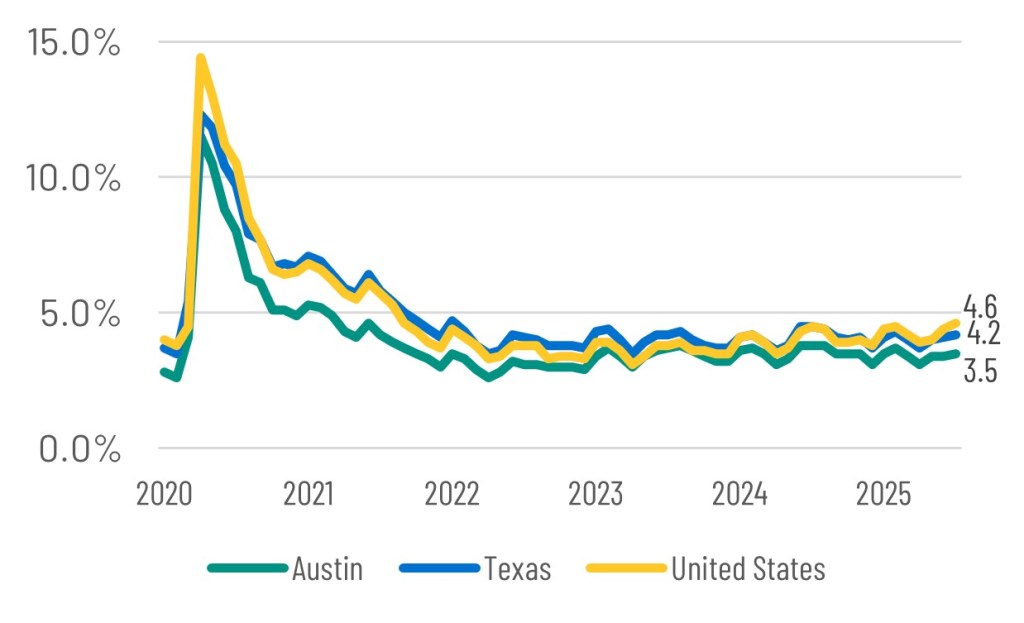
Unemployment Rate Comparison
The unemployment rate for the Austin region was 3.5% in July 2025, which was 0.3 better than the rate one year ago. Austin’s rate continues to perform better than that of TX at 4.2% and the U.S. at 4.6%. Additionally, Fort Worth, 3.9%; San Antonio, 3.9%; Dallas, 4.0%; and Houston, 4.5% were all higher than Austin’s rate.
Since recovering from a peak of 11.5% during COVID, Austin’s rate average 4.2% in 2021, 3.0% in 2022, and 3.5% in both 2023 & 2024. TX’s rate rose to 12.3%during COVID and declined to 5.6% in 2021 and has since average 4.0% the last 3 years. The US rate reached 14.4% in COVID and declined to 3.5% in 2022 & 2023 but rose to 4.0% in 2024.
Source: U.S. BLS, LAUS.
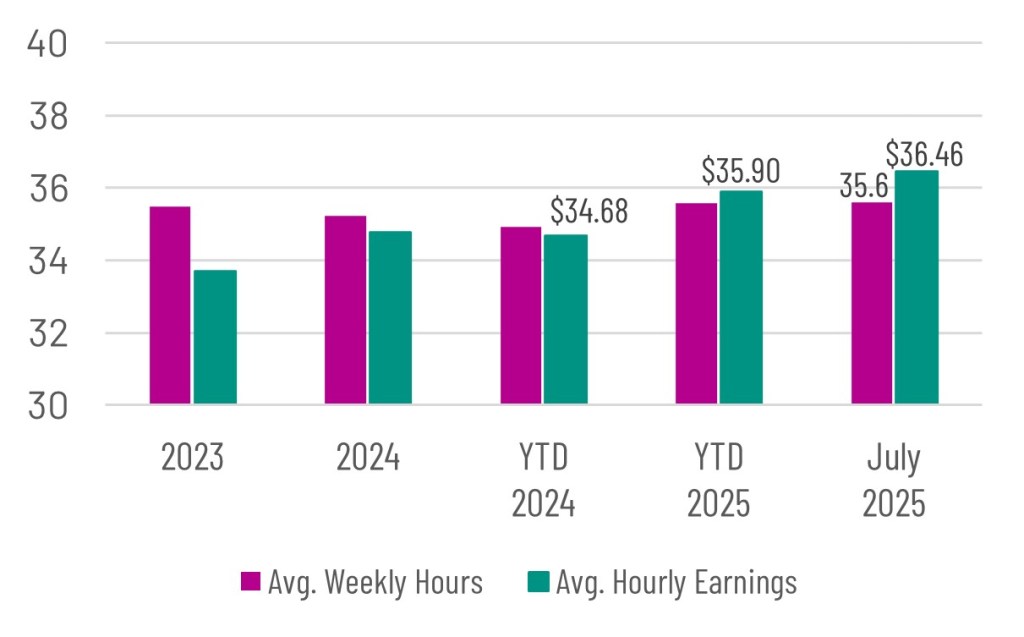
Workforce Hours & Earnings
The average number of hours worked for payroll jobs in the Austin region in July 2025 was 35.6, up by 2.3% from this time last year. For 2025 YTD, hours worked is also up 2.0% from 2024 YTD. Texas employees also worked more hours this year, compared to last; however, for the US the avg. was unchanged.
Average hourly earnings have risen on average 3% in Austin the last two years, while the average earnings in TX were up 5% and in the US 4.2%. For the first 6 months of 2025, average earnings in Austin were up 3.5% from $34.68 to $35.90. Increases both in the TX and the US were more profound at 4.9% and 4.0%, respectively.
Source:U.S. BLS, CES.
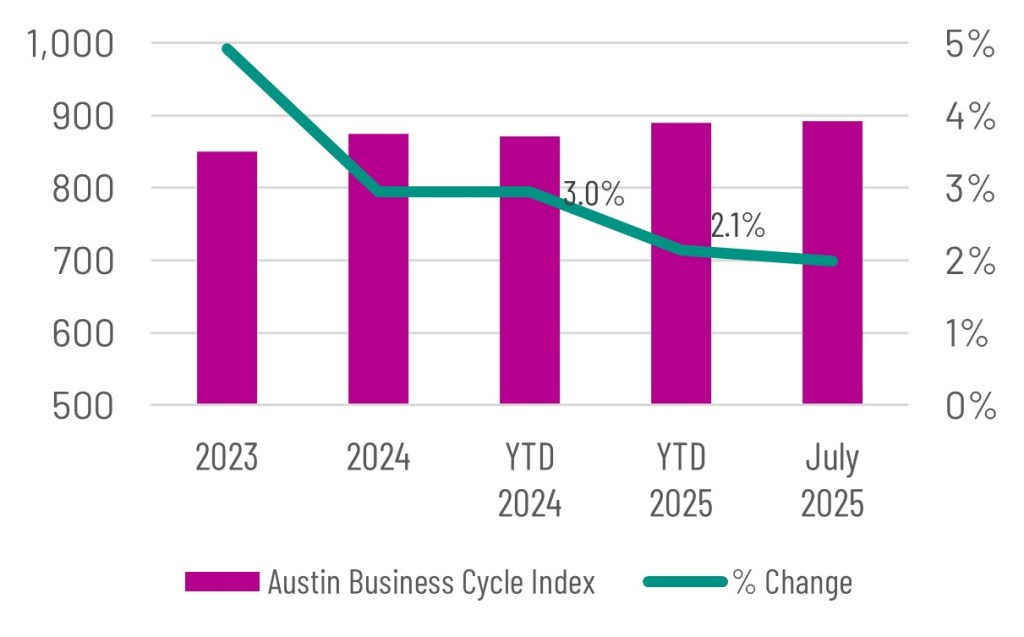
Metro Business Cycle Index
The Austin metro’s business cycle index continues to show growth in both the YTD and YOY comparison through July. After robust growth of 10 to 12% in 2021 & 2022, the rate slowed to 2.1% for YTD 2025 compared to YTD 2024 growth of 3.0%.
Statewide, the business cycle index grew by 3.8% from YTD 2024 to YTD 2025. Across Texas YTD growth in the other major metros was between 1.8% in Houston to 3.5% in Dallas. Fort Worth was at 2.5% and San Antonio was at 2.2%. Produced by the Federal Reserve of Dallas, the business cycle index reflects broad economic conditions including unemployment, inflationadjusted wage and retail sales growth.
Source:Dallas Federal Reserve.
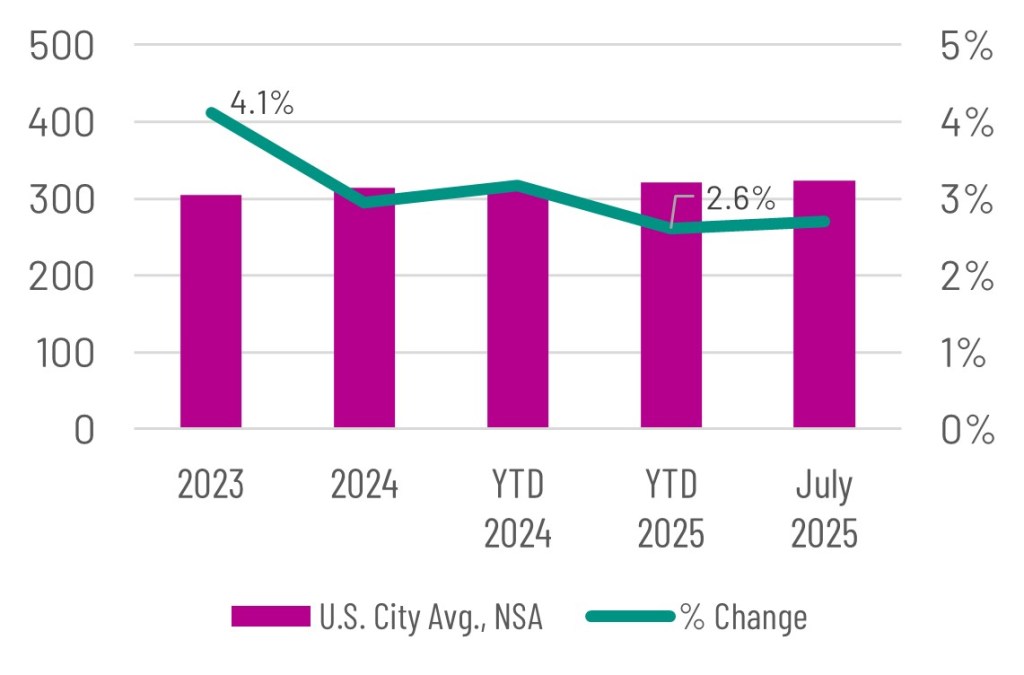
Consumer Price Index
After reaching a 40-year high of 8.0% in the annual percent change in 2022, the U.S. Consumer Price Index fell to 4.1% in 2023 and 2.9% in 2024. Year over Year change in July 2025 was 2.7%, essentially matching the 2025 YTD increase of 2.6%.
While a CPI is not produced for the Austin metro, the Dallas metro index was up only 0.9% in July 2025 over the same time last year, while the Houston index was up 1.8% in June 2025. The CPI index for these two areas are only produced every other month. Some of the biggest contributors to increasing inflation in the Index were Natural Gas, up 13.8%; Electricity, up 5.5%;Medical Services, up 4.3%; Shelter, up 3.7%; and Food, up 2.9%.
Source:U.S. BLS, CPI.
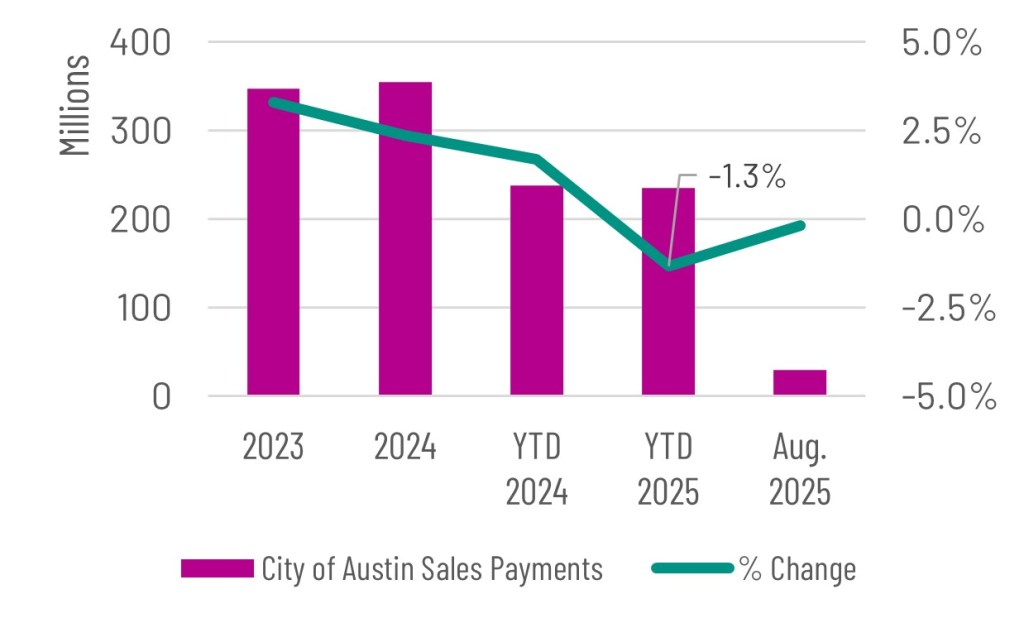
Sales Tax Receipts
Sales tax allocation payments to the City of Austin grew 3.3% in 2023 and 2.4% in 2024. However, year to date through August 2025, receipts are down by 1.3% compared to the same time last year and payments to Austin were down -0.2% in August 2025 compared to August 2024.
In Round Rock, receipts were up 1.4% in 2023 and down 1.4% in 2024, San Marcos received 4.2% more funds from sales tax payments in 2023 and 2.1% less in 2024. For August YTD, Round Rock’s sales are up 11.1% from 2024 YTD and San Marcos was down -0.5%. Statewide, August 2025 YTD sales tax collections are up 4.4% compared to YTD 2024.
Source: Texas Comptroller
AUS Airport Passenger Activity
Annual passenger counts through the Austin airport hit a record 22.1 million in 2023 and fell 1.5% in 2024. Through June 2025, YTD totals are 10.33 million down from the same time last at 10.82 million. June 2025 was the 6th- busiest month of all time with 2.014 million passengers, exceeding June 2024 by 0.1%.
Total cargo (including Belly freight, cargo and mail) totaled 301.9 million pounds in 2024, up 6.7% from 283.1 million pounds in 2023. The annual record for total cargo occurred in 2022 with 310.1 million pounds transported. For June 2025, YTD cargo totaled 134.4 million pounds, which was a 7.2% increase from the same time last year.
Source: City of Austin

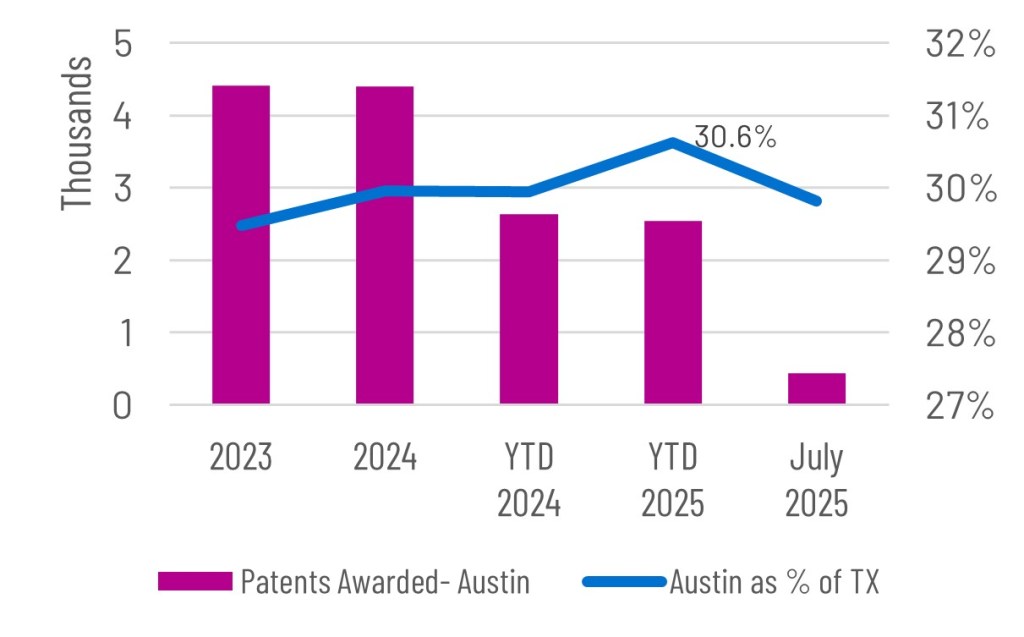
Patent Activity
Austin inventors are averaging an impressive 4,500 patents awarded each year during the 2020’s, which is higher than the 3,750 averaged during the 2010’s. Patent activity in July 2025 increased to 441, the highest since October 2023. YTD patent activity declined by 3.6% from 2,638 in 2024 to 2,543 in 2025.
Austin continues to represent approximately 30% of patent activity in TX. This is a truly remarkable data point since the Austin MSA only represents around 8% of the entire population of the State. Despite a lower number of patents awarded in Austin for YTD 2025, Austin’s share of TX patents increased to 30.6% from same time last year due to even slower patent growth for TX as a whole.
Source:U.S. Patent & Trademark Office.
Venture Capital Investment
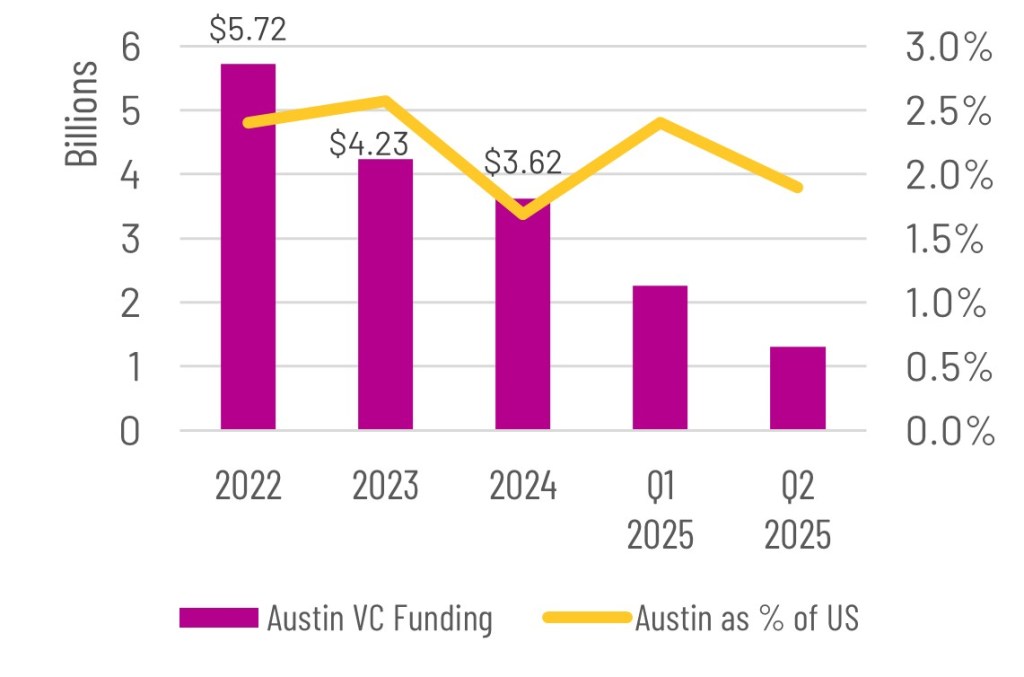
Venture Capital funding in Austin totaled $3.6 billion in 2024, down by 26% from 2023 funding of $4.23 billion. However, for Q1 and Q2 2025, VC funding was $3.56 billion, nearly topping the total for all of 2024. The top five funding rounds for 2025 include: Saronic, $600M; NinjaOne, $500M; Apptronik, $403M; Base Power, $200M; HalcyonAI, $125M.
Austin’s share of VC funding nationwide was 1.7% in 2024, down from 2.6% in 2023. For YTD 2025, Austin’s VC funding represents 2.2% of U.S. total funding. Statewide, Austin startups garnered 52.1% of all VC funding. Total number of VC deals in Austin were 171 in YTD 2025, down from 199 during the same time last year.
Source: Pitchbook.
Home Sales
Home sales in the Austin region peaked at 41,094 in 2021. For the last two years, total sales were about 30,500. In July, YTD sales are down by about 600 or 3.5% compared to the same time last year. Statewide, YTD sales in July were up 0.5% compared to 2024, while U.S. sales were down 1.3%.
The average sales price in the Austin region was $574,429 in July 2025, up from $571,484 one year ago. Likewise, the YTD sales price was trending slightly higher this year. In July 2025, months on inventory in Austin reached a high at 5.9 months that had not be seen since July 2011 when there was 6.1 months of supply.
Source: TX A&M Real Estate Research Center

Housing Permit Activity
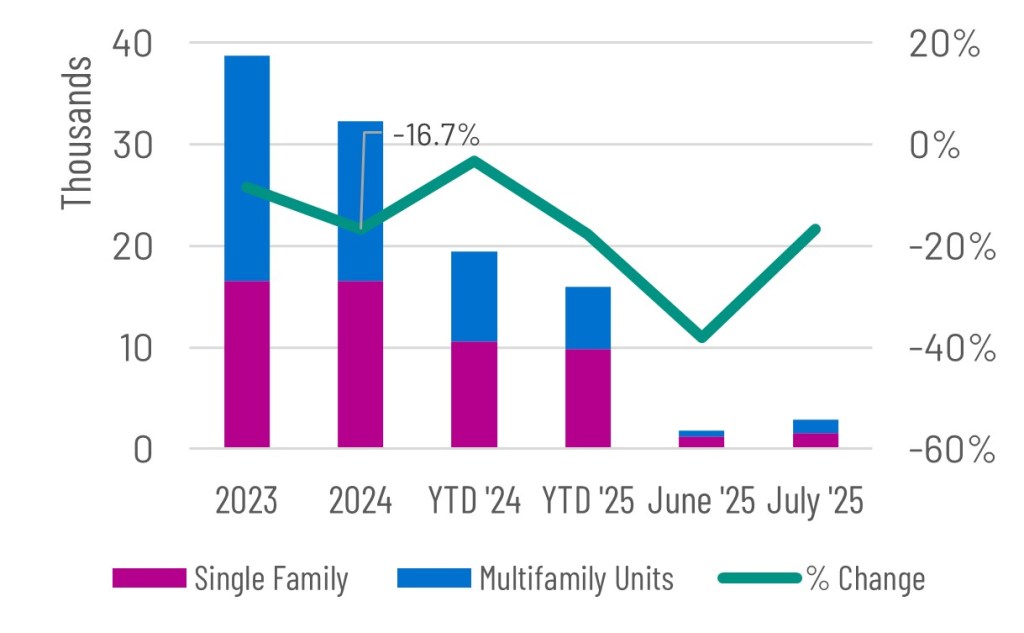
Building permits issued in the Austin region came down from historic highs of between 22,000 to 25,500 units in 2021 and 2022. Last year a total of 15,000 units were issued down 16.7%. For YTD 2025, a total of 16,000 units have been issued down from 19,400 during the same time last year. Nationally, permits were down 2.6% in 2024 and for YTD 2025 US permits are about 3.2% off last years pace.
Last year in the Austin region, the share of single-family units, 51.1%, exceeded multifamily for the first time since 2021. For YTD 2025, 61.5% or 9,850 units were single family out of the 16,000 permitted units, compared to 6,150 that were multifamily.
Source: U.S. Census Bureau Building Permits Survey
Commercial Real Estate Activity
After having office vacancy rates of around 7 to 8% just before COVID in the Austin region, continued new construction delivery and softened leasing activity has brought the office vacancy rate up to 17.0% in 2025 compared to 16.5% in 2024. The current office market totals 137M SF, having added 17M SF of new inventory since Q2 2020. Quoted lease rates in 2025 Q2 ticked down to $43.86 from $44.13 in Q2.
Likewise, the Austin industrial market has grown to 172M SF, adding 57M SF since 2020 Q2 or 50% growth over 5 years. YTD vacancy rate in 2025 at 12.8% is up from 9.1% in 2024. Quoted rates ticked down slightly to $14.74 in 2025 Q2.
Source: CoStar

Upcoming Releases
September is a busy month with two notable data releases. The Census Bureau’s American Community Survey One-year estimates were released providing a broad range of social, economic, housing & demographic data for geographic areas over 65,000 people. The September Bureau of Labor Statistics job’s report will provide new unemployment & growth stats through August. Lastly, the Federal Reserve’s monetary policymakers met Sept. 16-17, lowering rates by 0.25 to 4-4.25%.
- U.S Census Bureau’s American Community Survey (Annual Socioeconomic Data): September 11, 2025
- U.S. BLS CES and LAUS monthly report (Metro Job and Unemployment Release): September 19, 2025
More Info & downloads
- Labor force, employment & unemployment
- Employees on nonfarm payrolls
- Hours & earnings
- Consumer price index
- Metro business cycle index
- Sales tax & retail sales
- Housing permits
- Home sales, listings & prices
- Air service
- Patent activity
- Commercial real estate
For questions about this data, please contact Chris Ramser, Vice President, Research (512.322.5662) or Joseph Morones, Director, Research.